The 3% Rule: A Data-Driven Approach to Setting Your Passing Target
Part 9 in the "What Really Wins Sets" Series

Part 9 in the "What Really Wins Sets" Series
Howdy folks!
Welcome back to my "What Really Wins Sets" series. After five posts focused on the Point Scoring phase, today I'm shifting my focus to the Side Out phase. To kick that off, I'm starting by trying to answer a fundamental question that I know many coaches have strong points of view on; Where should our passing target be in serve receive?
Nearly every coach I've met has a point of view on this question, some of them quite strongly held! Many coaches believe in trying to pass the ball to a target about ~3 feet off the net as that's the distance where their setters have the most options and can easily run a highly effective offense (which the data I'm going to share with you confirms is true).
I've met other coaches who are advocates for a passing target quite a bit farther off the net, maybe even 5 or 6 feet off. They are focused on minimizing overpasses and giving themselves more opportunities to attack. And of course I've seen coaches advocate for everything in between.
But I've never seen much in the way of data to back up these arguments. My goal today is to change that and walk you through a data driven approach to setting passing targets that hopefully you can use in your gym.
I want to start the discussion by proposing a simple idea:
1. Every team has some variability in their passing.
2. Some passes go to their target, some go deeper in the court, some go tight to the net and some are overpasses.
3. Depending on how skilled a team is at passing, the range of these outcomes can be smaller (highly skilled) or larger (less skilled).
I suspect that idea isn't controversial. Given this skill based range of passing outcomes exists, I’m proposing that we shouldn't ask the question "Where is the best place to pass to maximize my teams attacking efficiency?". Instead, we should ask the question "Given my teams passing skill level and range of passing outcomes, where should our passing target be to maximize the number of points we score while minimizing the number of points our opponent scores?"
As we dive into the details, you'll see that the answer, for most teams, is very likely "farther from the net than your current target".
Important note: This blog post relies heavily on the location data I've extracted from 5,107 DVW files. As many of you know, this location data definitely isn't perfect, and usually has an error rate of 3-4%. That can be pretty annoying when reviewing data for individual matches, but when used in aggregate across thousands and thousands of touches, it's reasonably safe to assume that the errors cancel each other out. In this analysis I'm keeping that in mind and making sure to only report numbers that have hundreds and, in most cases, thousands of data points backing them up.
The Expected Outcome Approach
To answer this question, I built an expected outcome based model that combines three datasets derived from the passing results from every 2025 NCAA DI Women's Volleyball match (682,712 total pass attempts). Those three data sets are:
1. An attack efficiency surface: how effective on average are the attacks that result from passes to a given location?
2. An overpass penalty: how frequently does the opponent score a point when a team overpasses?
3. Each team's passing distribution: how tightly (or loosely) their passes cluster around their passing centroid (the calculated average center point of all their passes)
I used these three datasets to build a model that places a team's passing distribution (their measured 2025 scatter pattern) at every possible point on the court. At each passing target point, my model computes the expected attack efficiency based on their distribution (including the penalty for overpasses), then finds the passing target point that maximizes the overall expected outcome (i.e. expected number of kills - expected number of opponent kills).
Let's walk through each dataset and see how its used.
Step 1: Where Passes Land and Expected Attack Efficiency
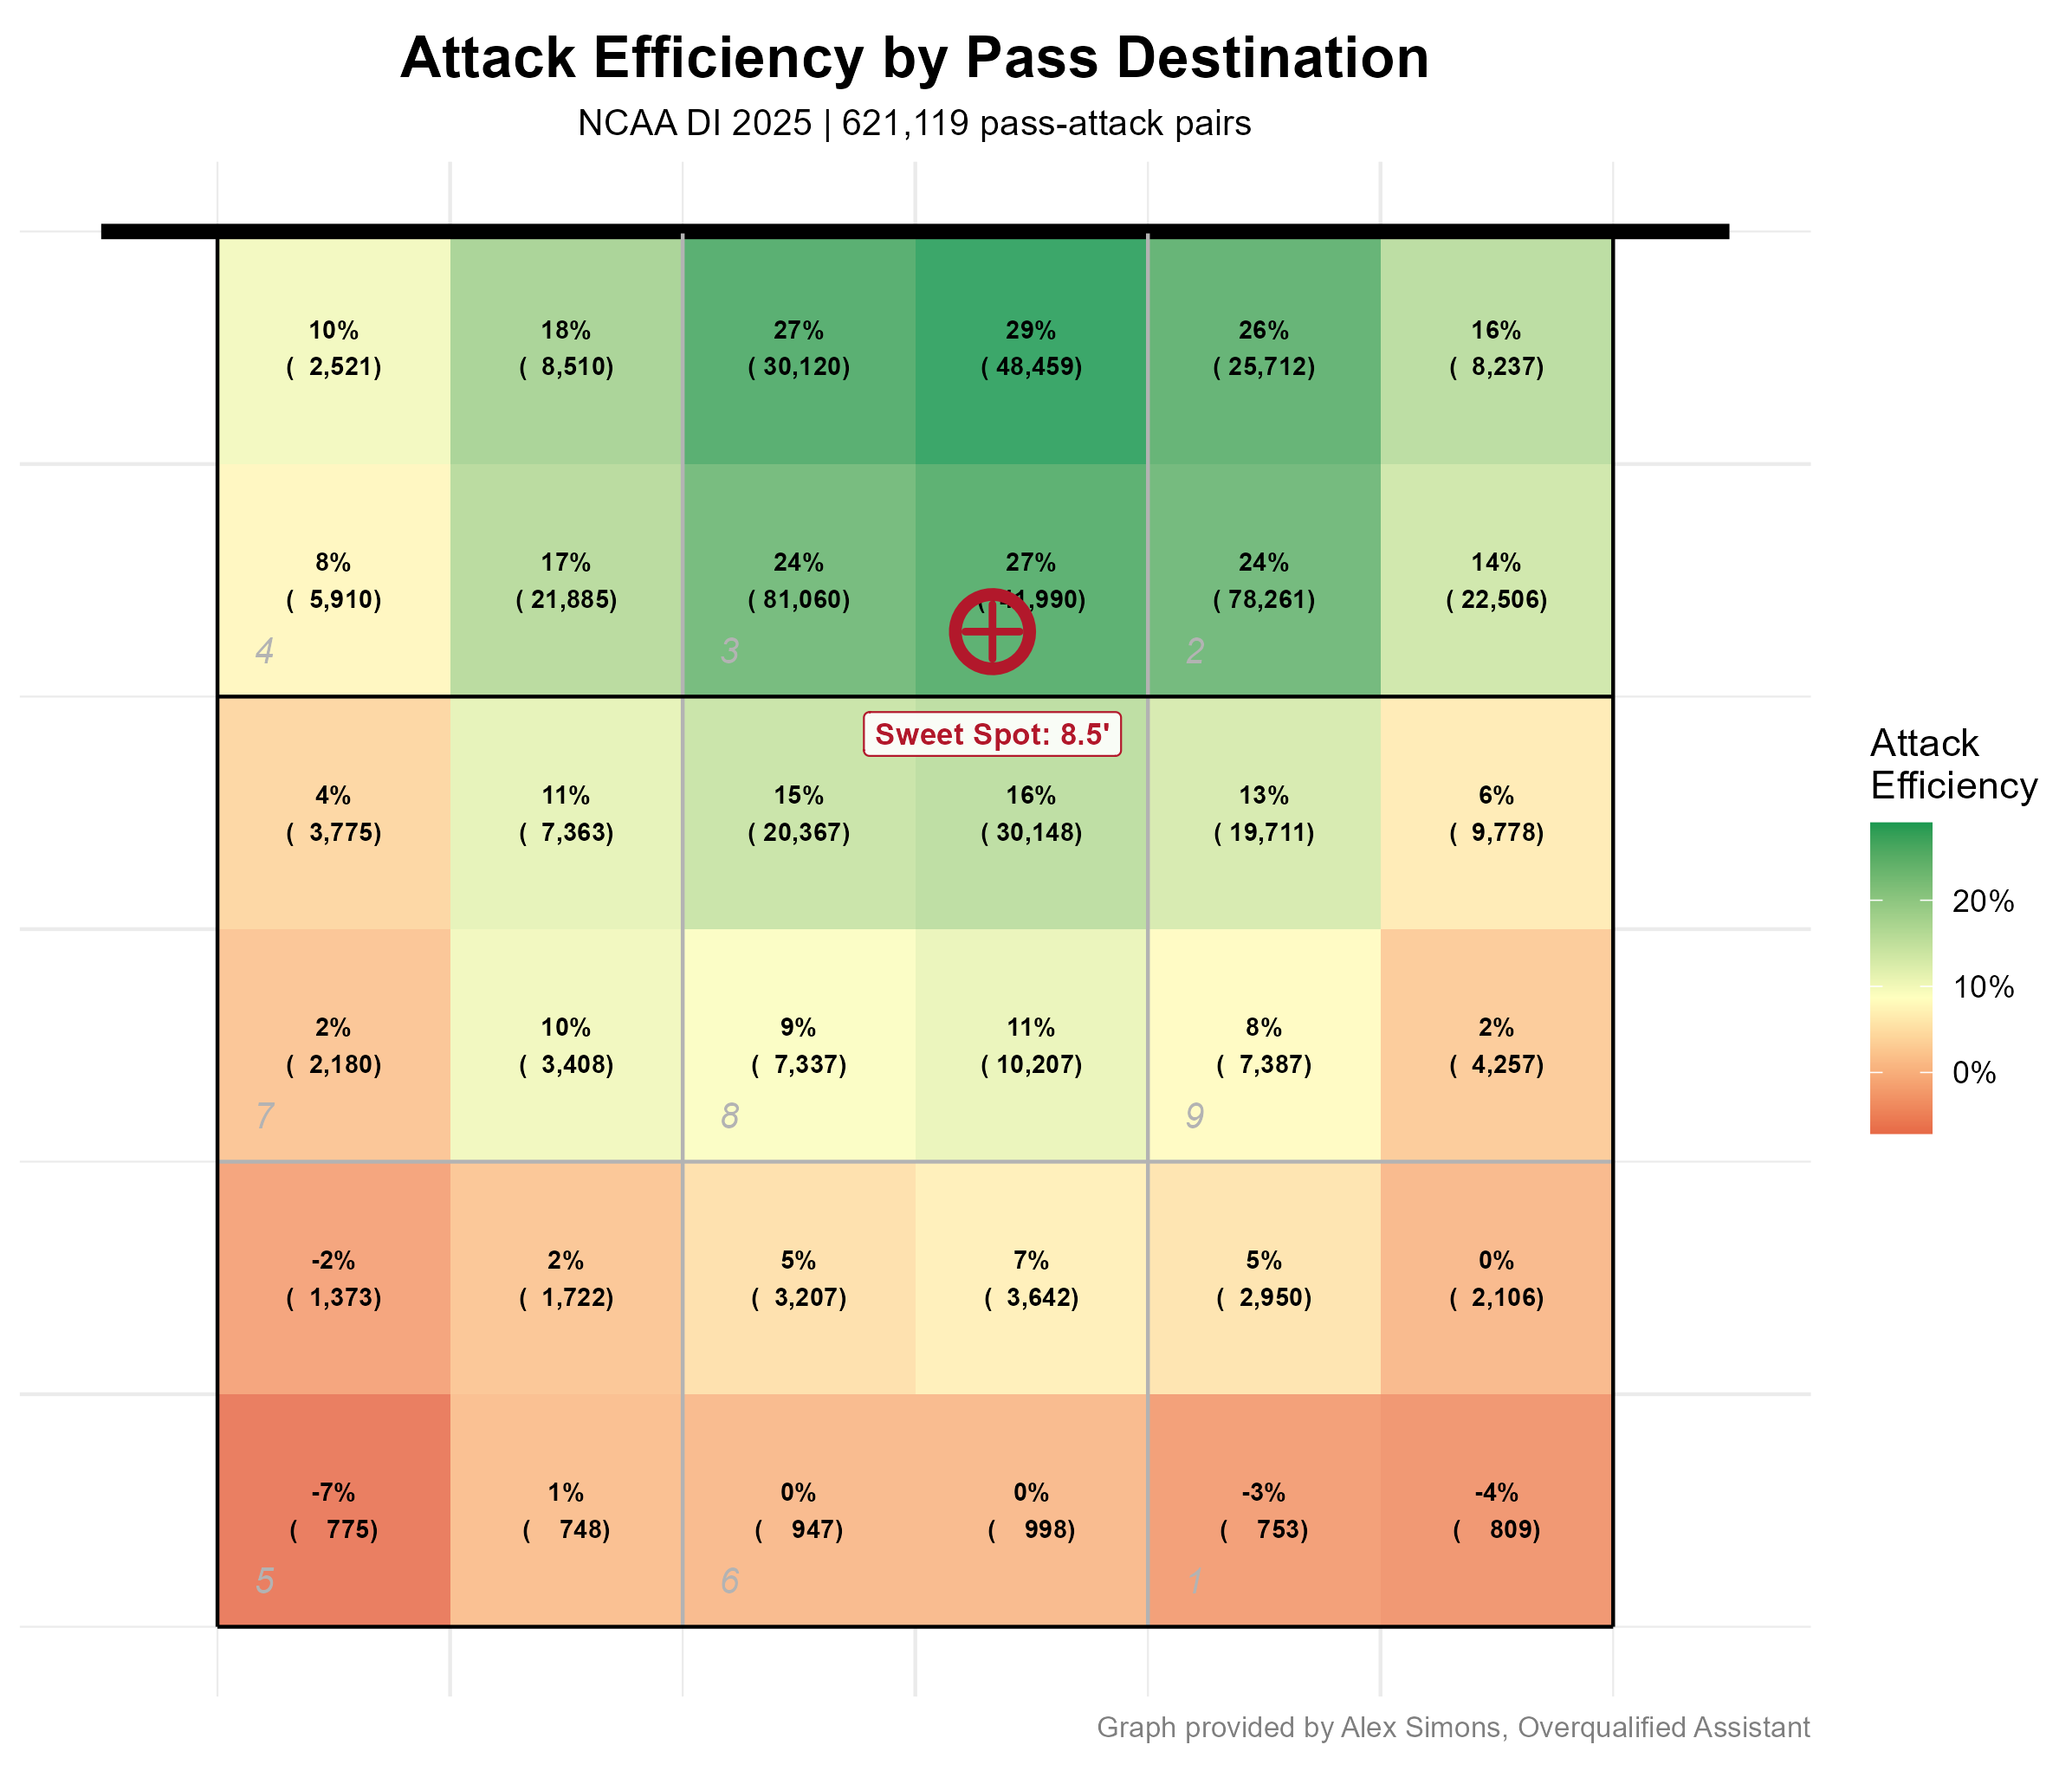
For every serve reception in the 2025 NCAA DI season, I traced the resulting pass, set, attack sequence. The pass destination is measured by where the setter contacts the ball (the set's starting coordinate in the match data), and the attack outcome is recorded as a kill (+1), error or blocked (-1), or kept in play (0). This gives us 621,119 pass-to-attack sequences across all of DI.
I used that data to build a a 36-cell attack efficiency heatmap. The value (and color) in each cell represents the average attack efficiency % of all the passes to that cell. Every cell has > 700 observations, and most have thousands. So the 95% confidence intervals are very tight.
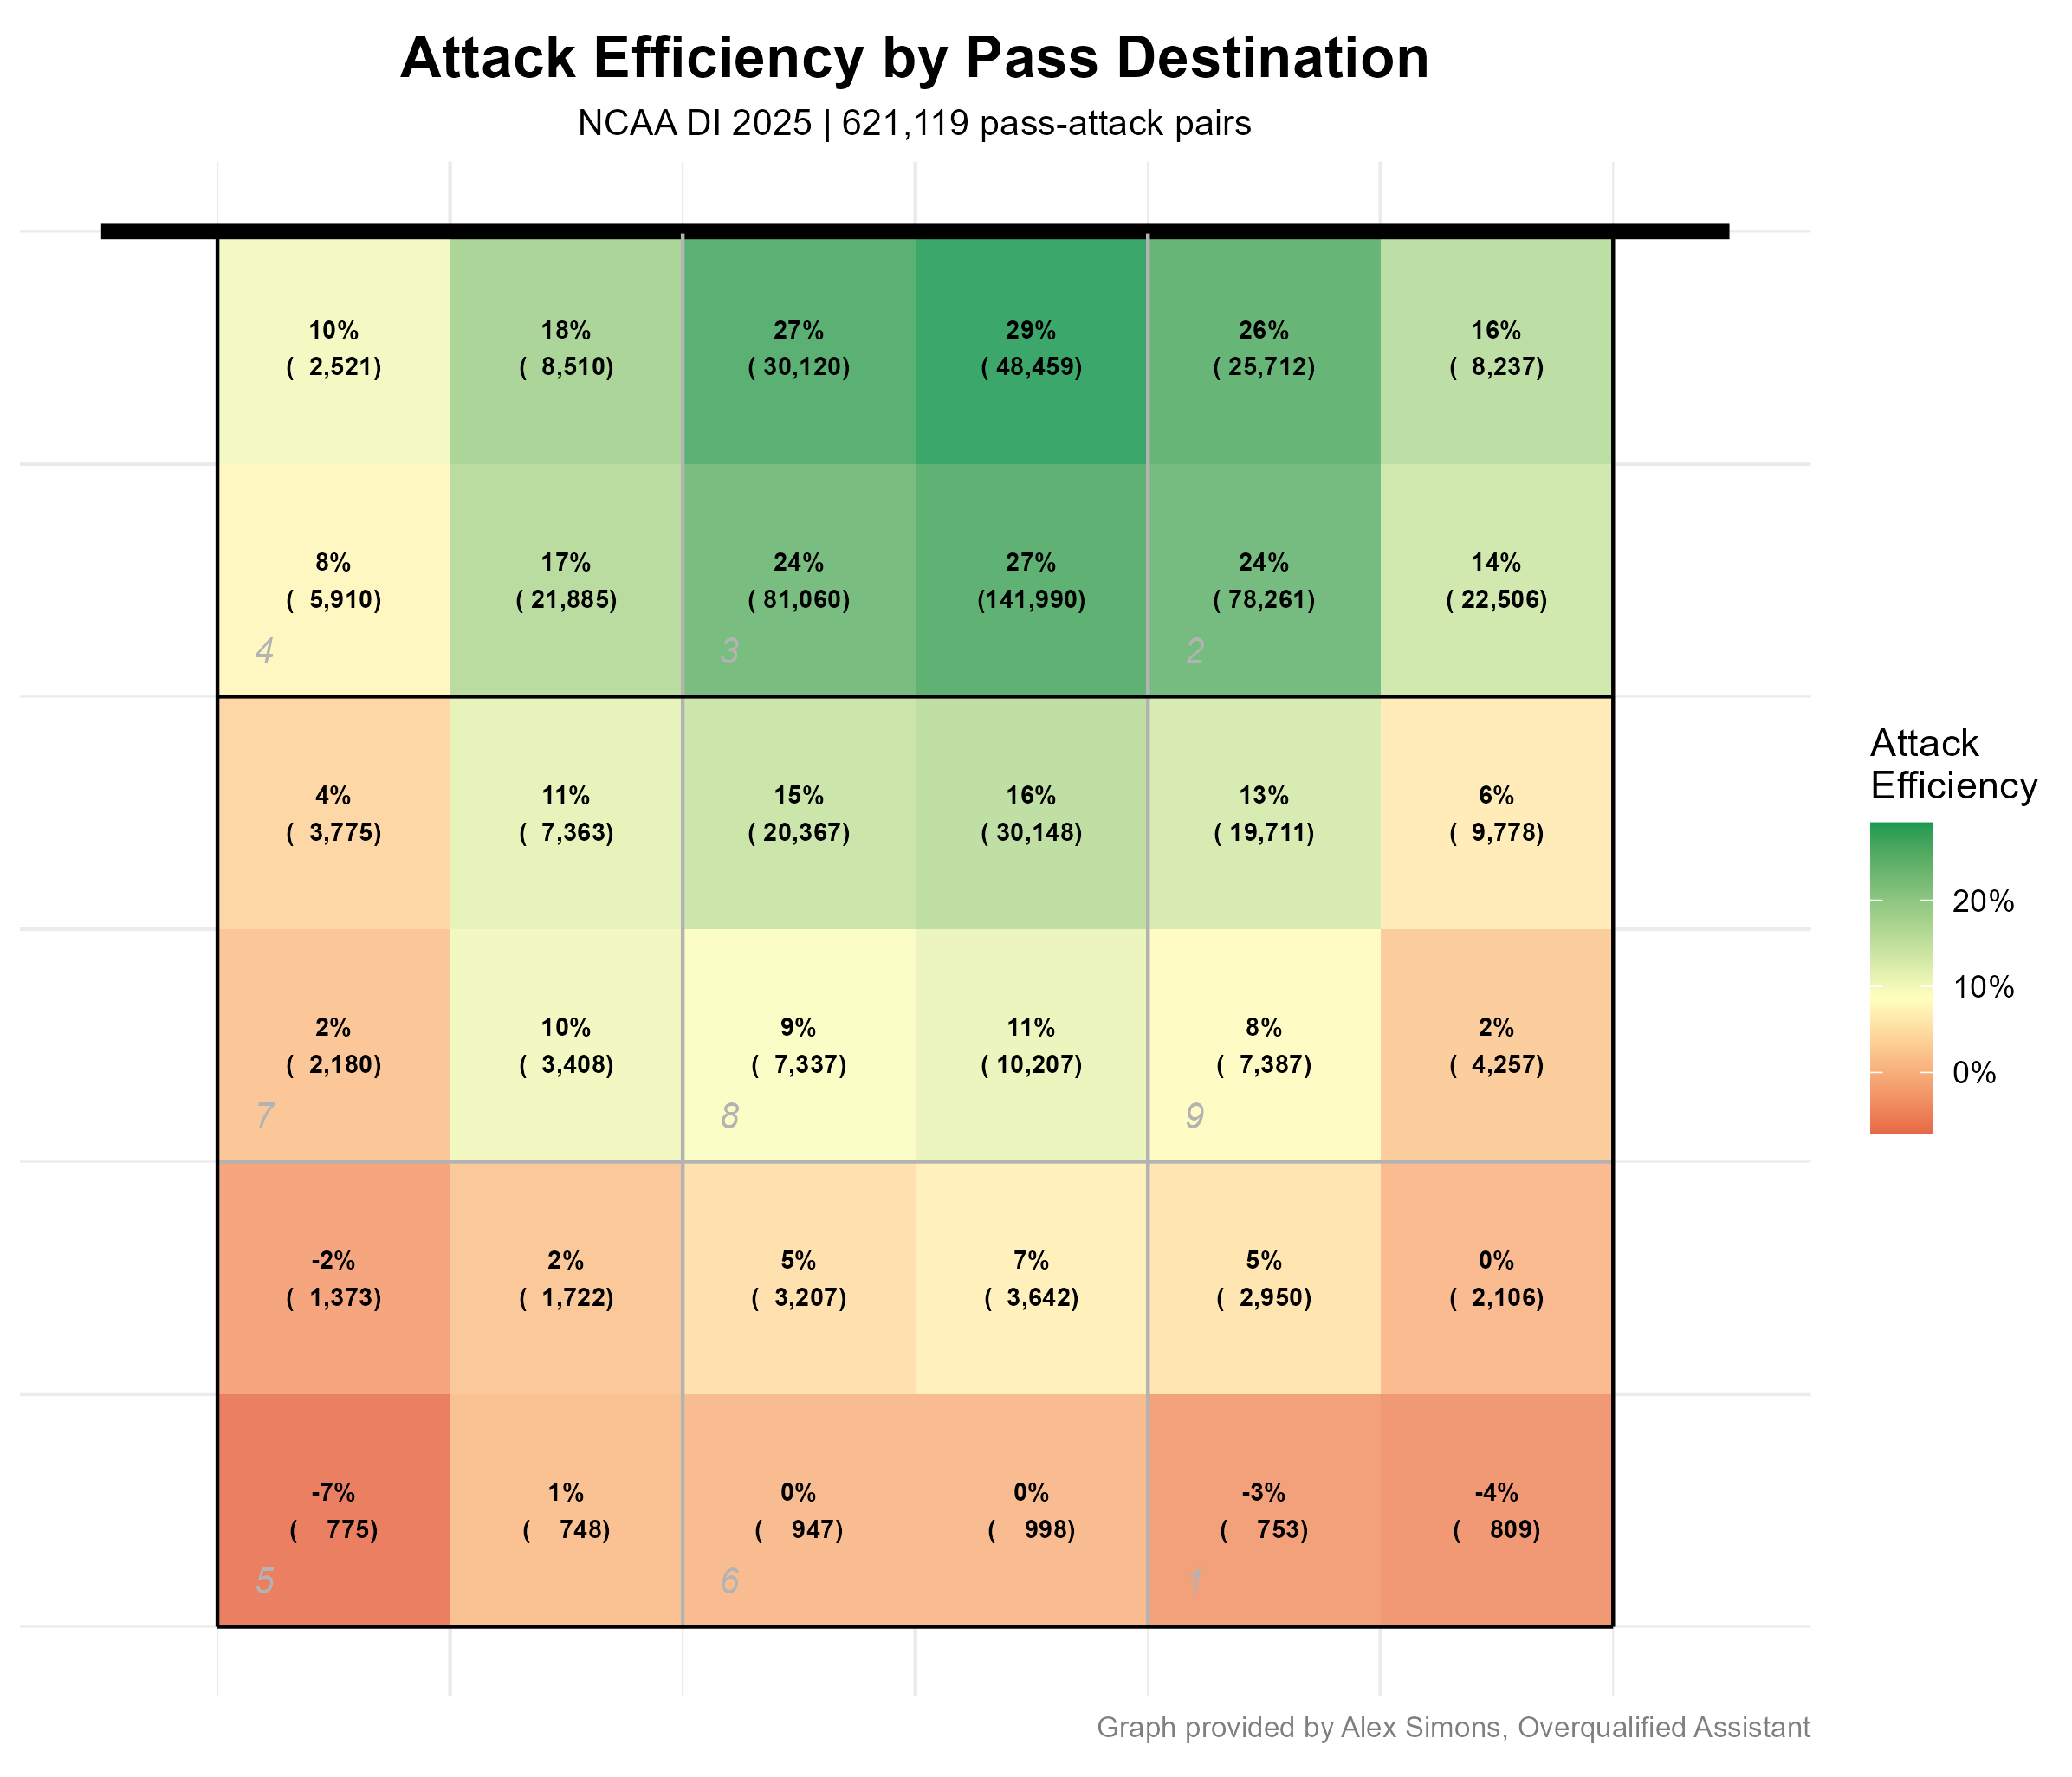
The pattern is what you would expect: passes closer to the net and just to the right of center produce higher attack efficiency (up to 29% in the cells nearest the net), while passes deep in the backcourt produce attack efficiencies near or below zero. No surprises here.
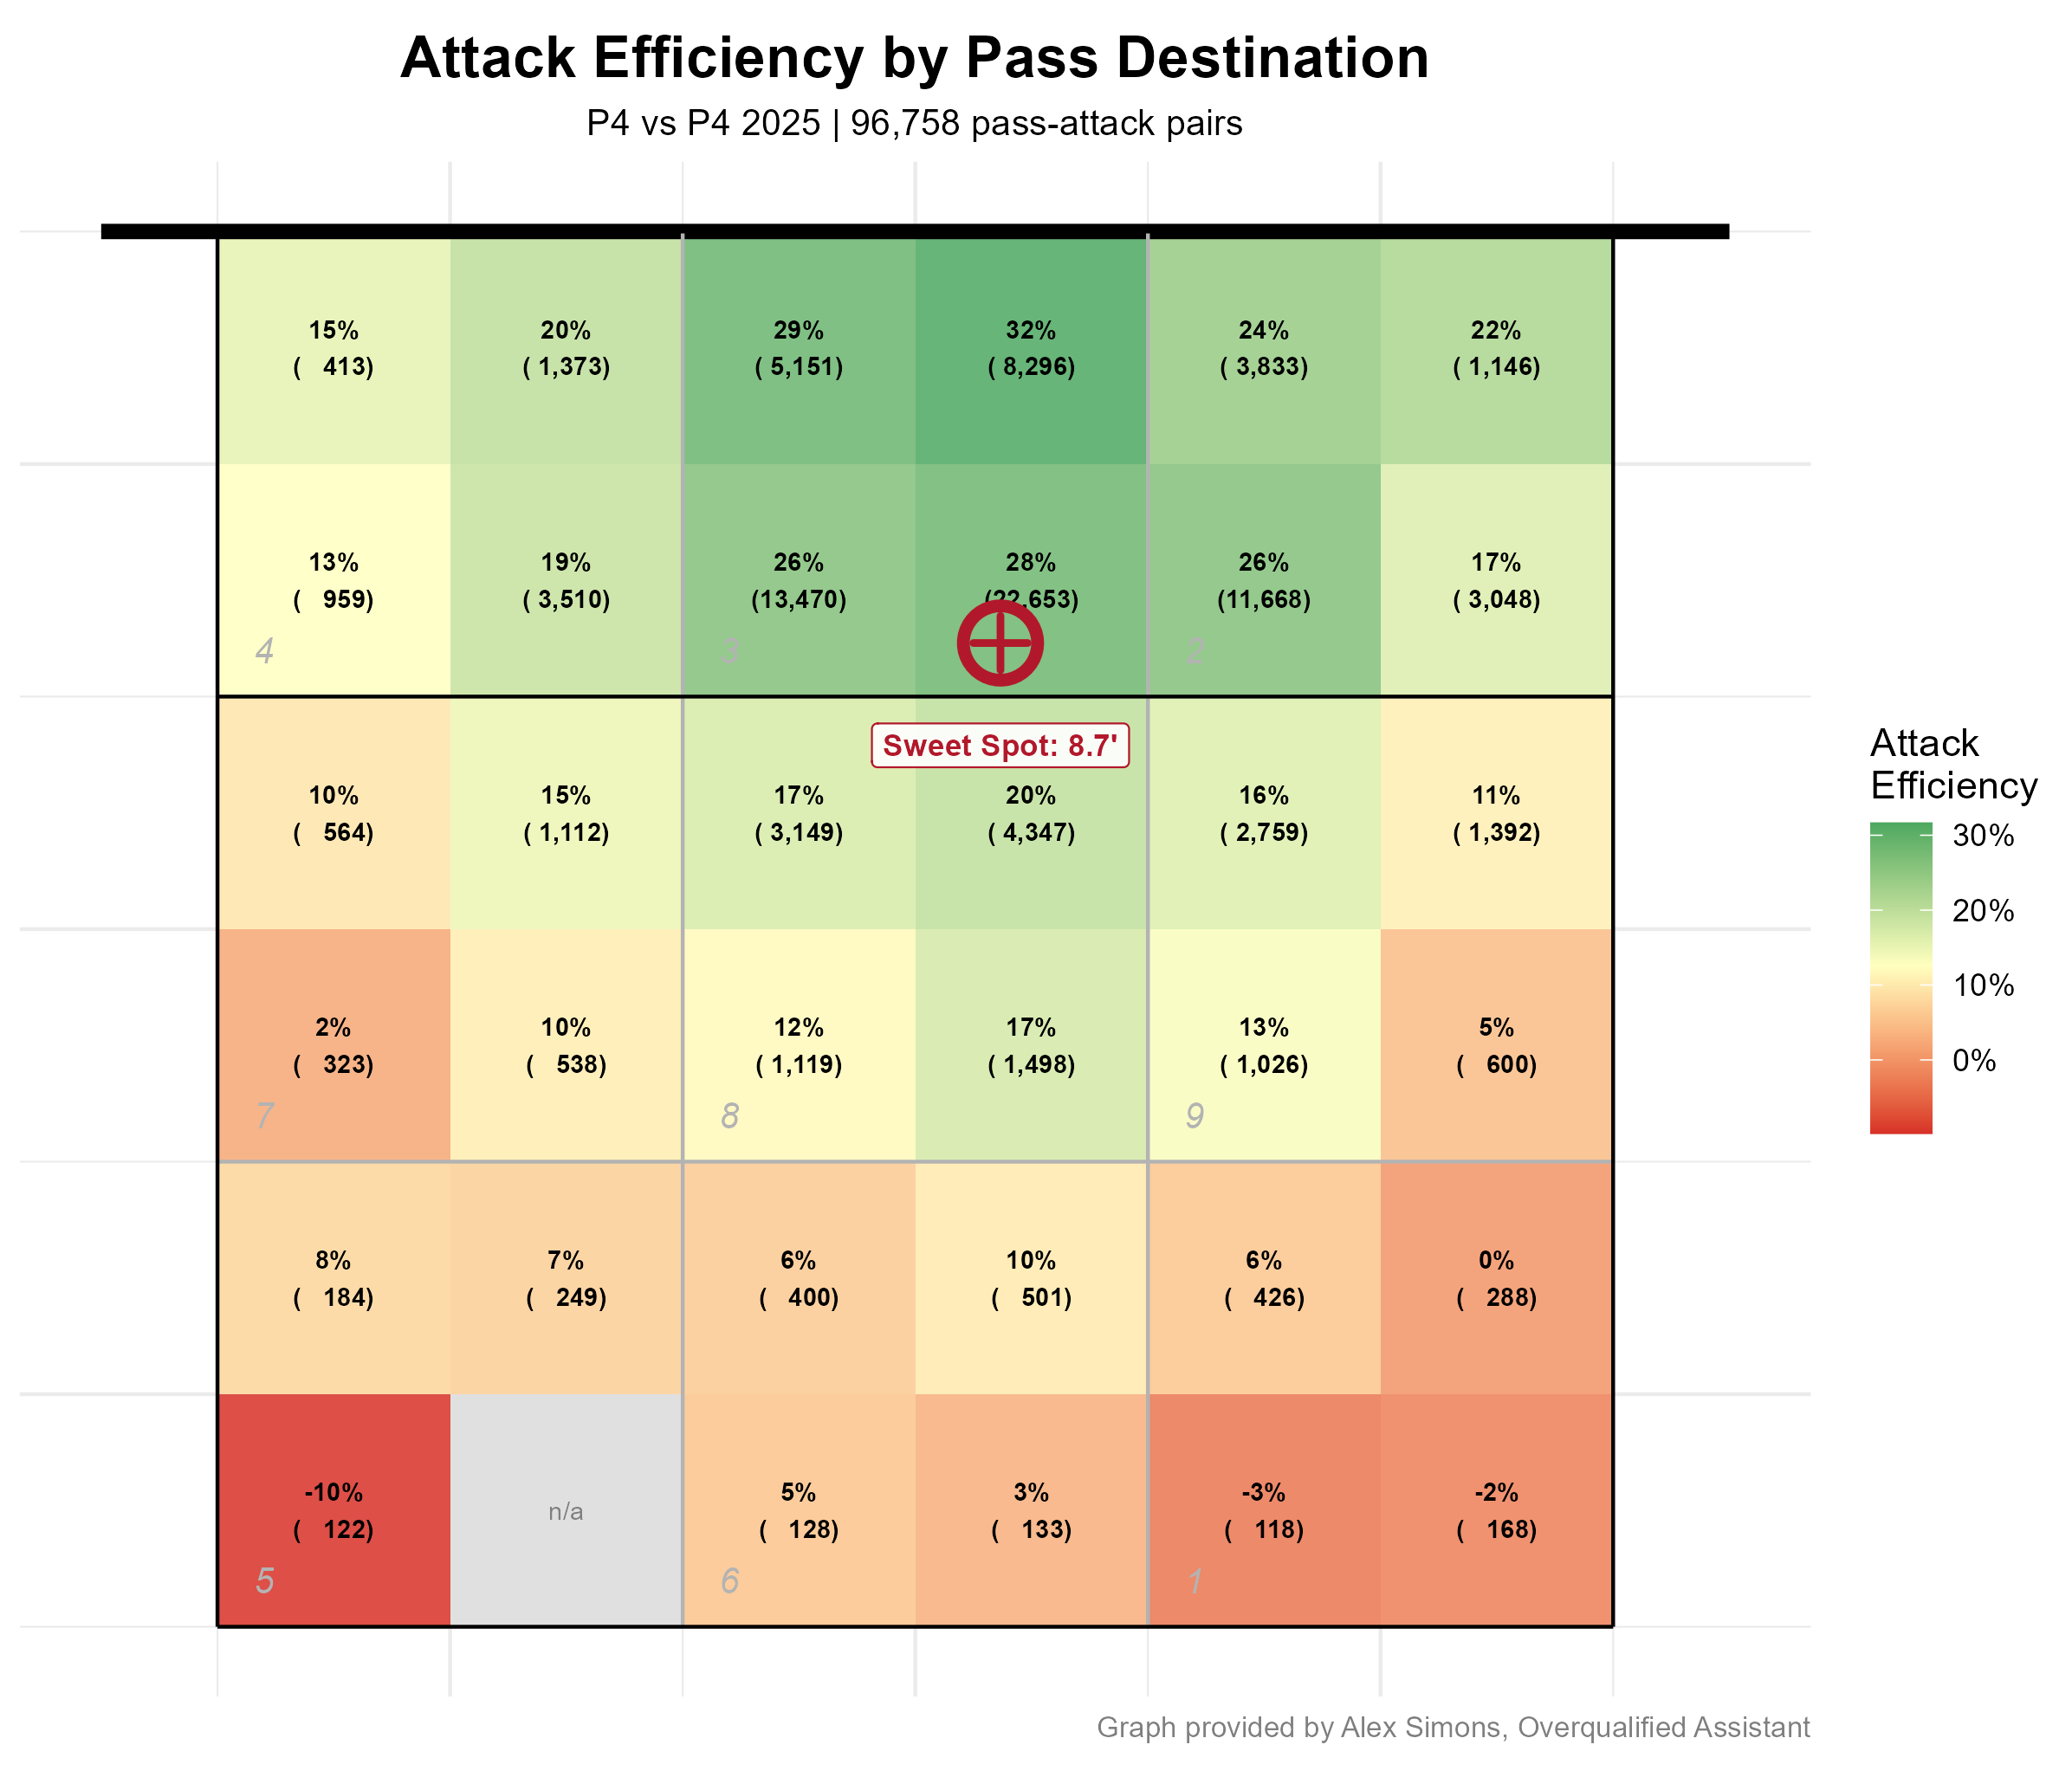
Here's the same heatmap filtered to only P4 vs P4 matches (games where both teams are from a Power 4 conference), covering 96,758 pass-to-attack pairs across 67 teams:
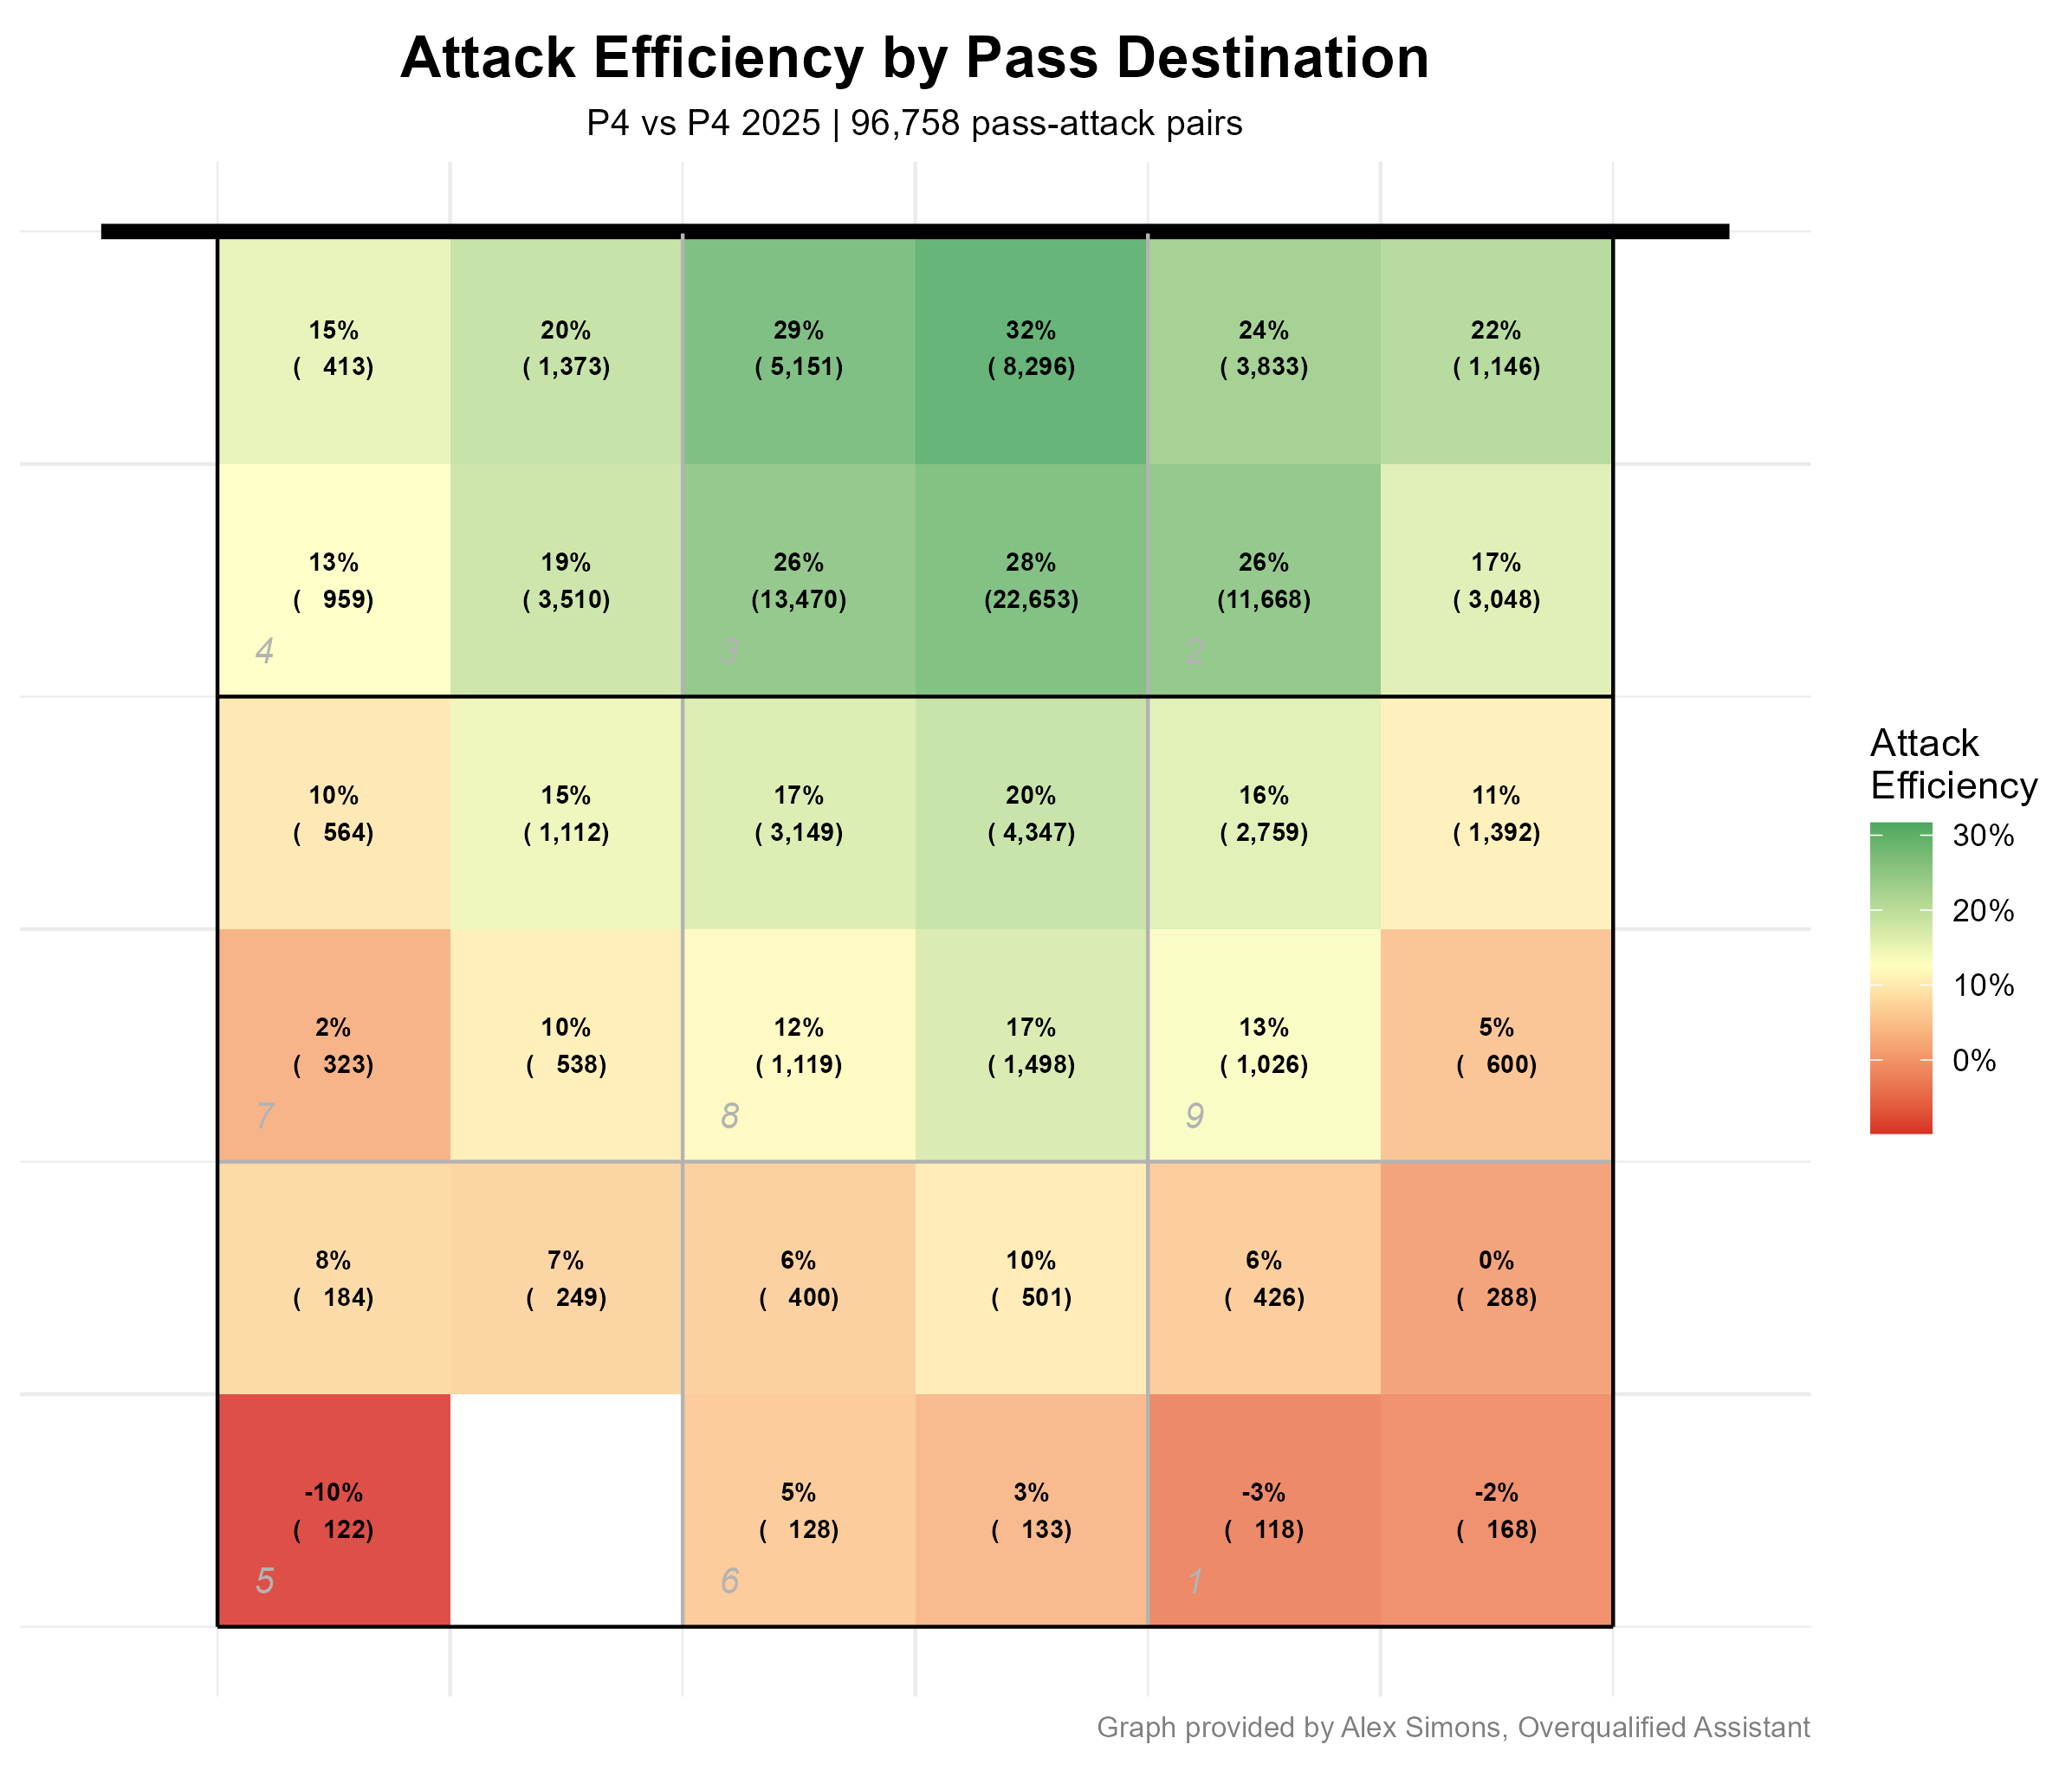
The pattern is essentially the same, with overall efficiency numbers a little higher across the board. P4 teams convert more efficiently at every location.
Both heatmaps temptingly shout the same thing: pass close to the net! But there's a huge cost hiding in this picture that the heatmaps don't show. We'll get to that next.
Coaching takeaway: Attack efficiency drops off steadily as passes land further from the net. The data from 621,119 pass-to-attack sequences confirms what every coach intuitively knows: passes that are about 3 feet off the net produce better attacks. But as we'll see, "aim closer" actually isn't the right advice.
Step 2: The Overpass Penalty
When a team overpasses, sending the ball back to their opponent, they don't just loose a chance to score, they also give their opponent an opportunity to attack. I calculated the average outcome of overpasses in 2025 Women's DI season:

Overpasses result in very high opponent attack efficiencies. 55.2% of overpasses result in an opponent kill with a 10.2% error rate bringing overall attack effectiveness on overpasses to 45%. For comparison, Women's DI attack efficiency is 20%. So when you overpass, your opponents gets 2.25X better than normal chance to score a point.
Now you might look at a 4.7% overpass rate and think it's not a big deal. But the math tells a different story. Each overpass flips an expected outcome from something positive (your attk eff%, typically around +20%) to something deeply negative (opponent attk eff%, which is -45% from your perspective). That's a swing of 65 points in expected outcome value per overpass.
An easy way to conceptualize this is to recognize that from an expected outcome point of view, it takes slightly more than three good or perfect passes to get back to "even" after an overpass!
This penalty is what creates the core tradeoff here. Passing closer to the net improves your attack efficiency on the passes that land on your side of the net, but increases the chance of an overpass that hands the opponent a high probability opportunity. The question is where those two forces balance out.
Coaching takeaway: Overpasses are one of the most costly outcomes in serve receive, second only to getting aced. An overpass rate that seems modest (around 5%) creates a significant drag on your side-out offense because of how efficiently opponents convert those free attacks. A 2% decrease in overpasses has a positive impact on expected outcome equal to a 6% increase in pass quality! Any tactical choice that reduces overpass rate by even 1 - 2 percentage points can meaningfully improve your team's success.
Step 3: How Accurate Is Your Passing?
This is where the analysis becomes team-specific. For each of the 348 DI teams for which I have pass location data, I computed the standard deviation (SD) of where their passes went using a set of X & Y coordinates:
Lateral SD (the X coordinate): the left-to-right spread of passes
Depth SD (the Y coordinate): the close-to-far spread (distance from the net)
These two numbers define each team's passing "fingerprint." A team with small SDs has a narrow, consistent passing distribution. A team with large SDs spreads their passing distribution across a wider area. Across all of DI:
Median lateral SD: 5.3 feet
Median depth SD: 4.4 feet
There's a wide range in these numbers, and the range matters. A team with a depth SD of 3.5 feet has a fundamentally different risk profile than a team at 5.0 feet, even if both aim at the same spot on the court.
To illustrate what this looks like on the court, here's Nebraska (the best passing teams in P4 last year) side by side with Penn State (a middle of the P4 pack passing team):

And here are some visuals to illustrate what's going on here.
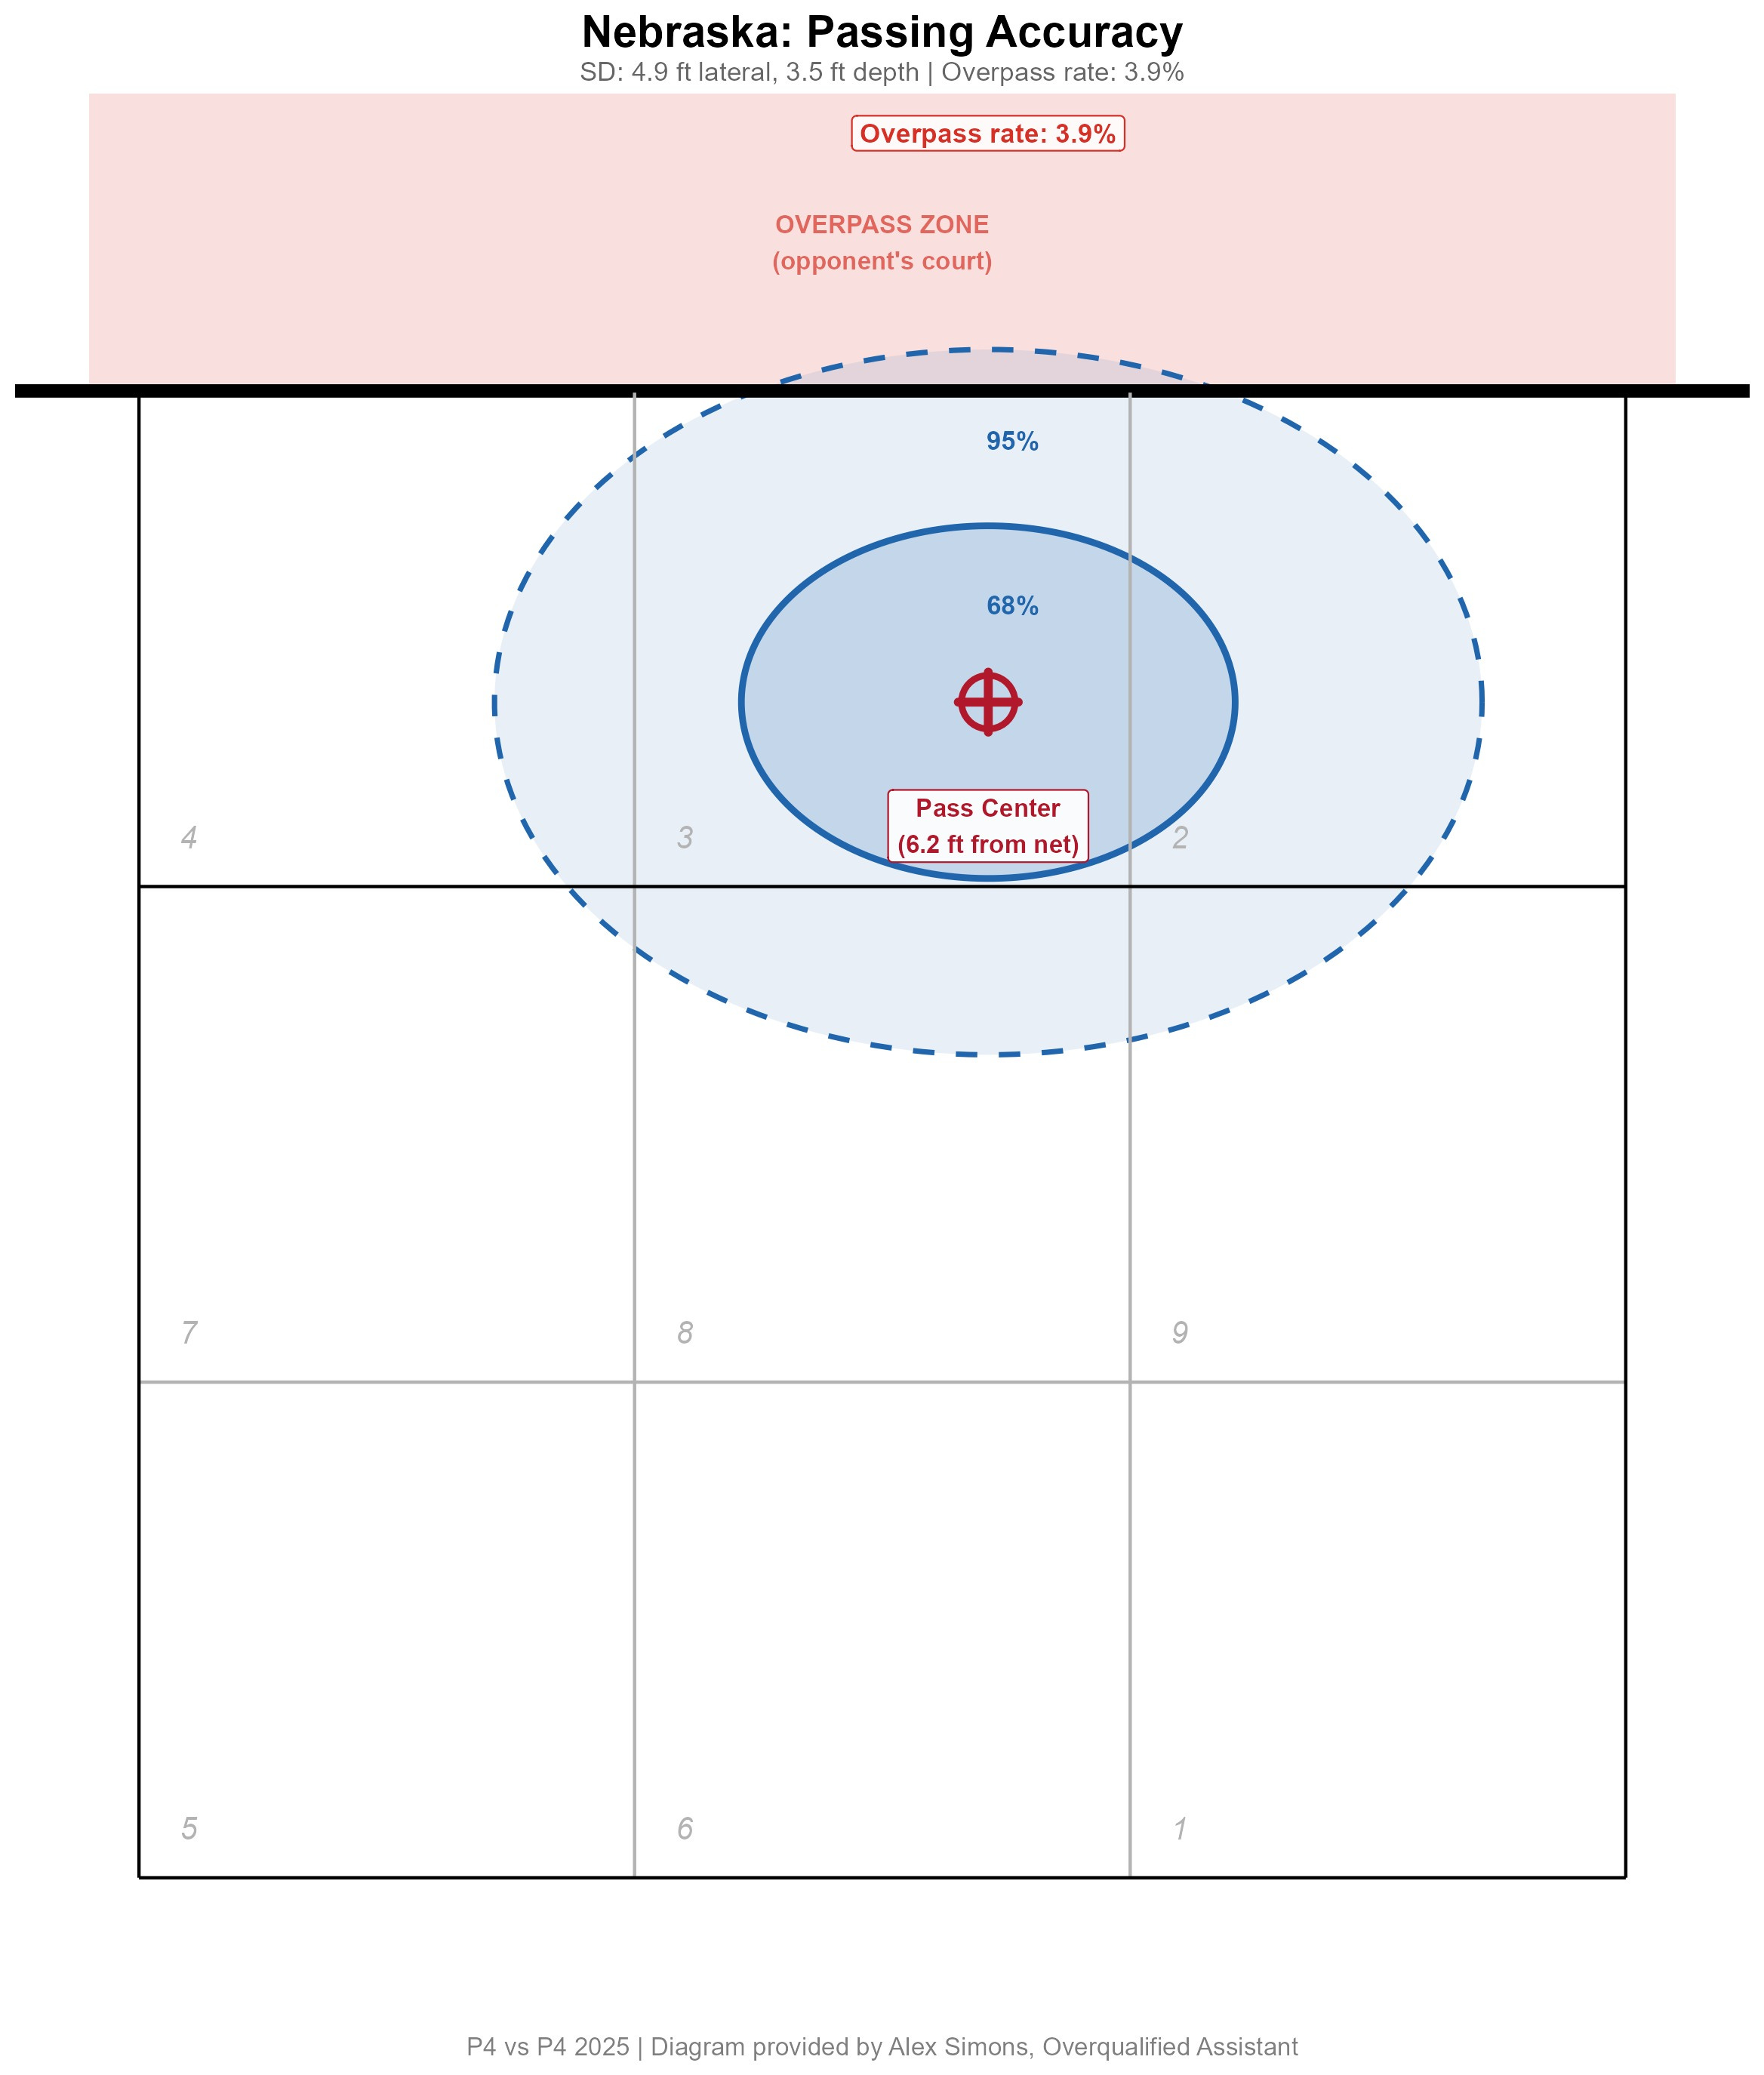
First up is a diagram representing Nebraska's passing results. The inner ellipse with the solid boarder represents where every Nebraska pass within one standard deviation (SD) of their actual passing center point went (68% of their passes). Look at how tight that ellipse is! Nebraska's setter only has to take two or three steps to get to the pass 68% of the time.
Oh, to be Bergen Reilly!
The ellipse with the dashed border shows where every Nebraska pass within two standard deviations of their actual passing center point went (95% of their passes). Nebraska's SD was the lowest of any P4 team last year, so these ellipses are pretty small.
Note: Obviously I don't know where Nebraska's actual passing target was. All I can tell you from the stats is where the actual center point of all their passes was.
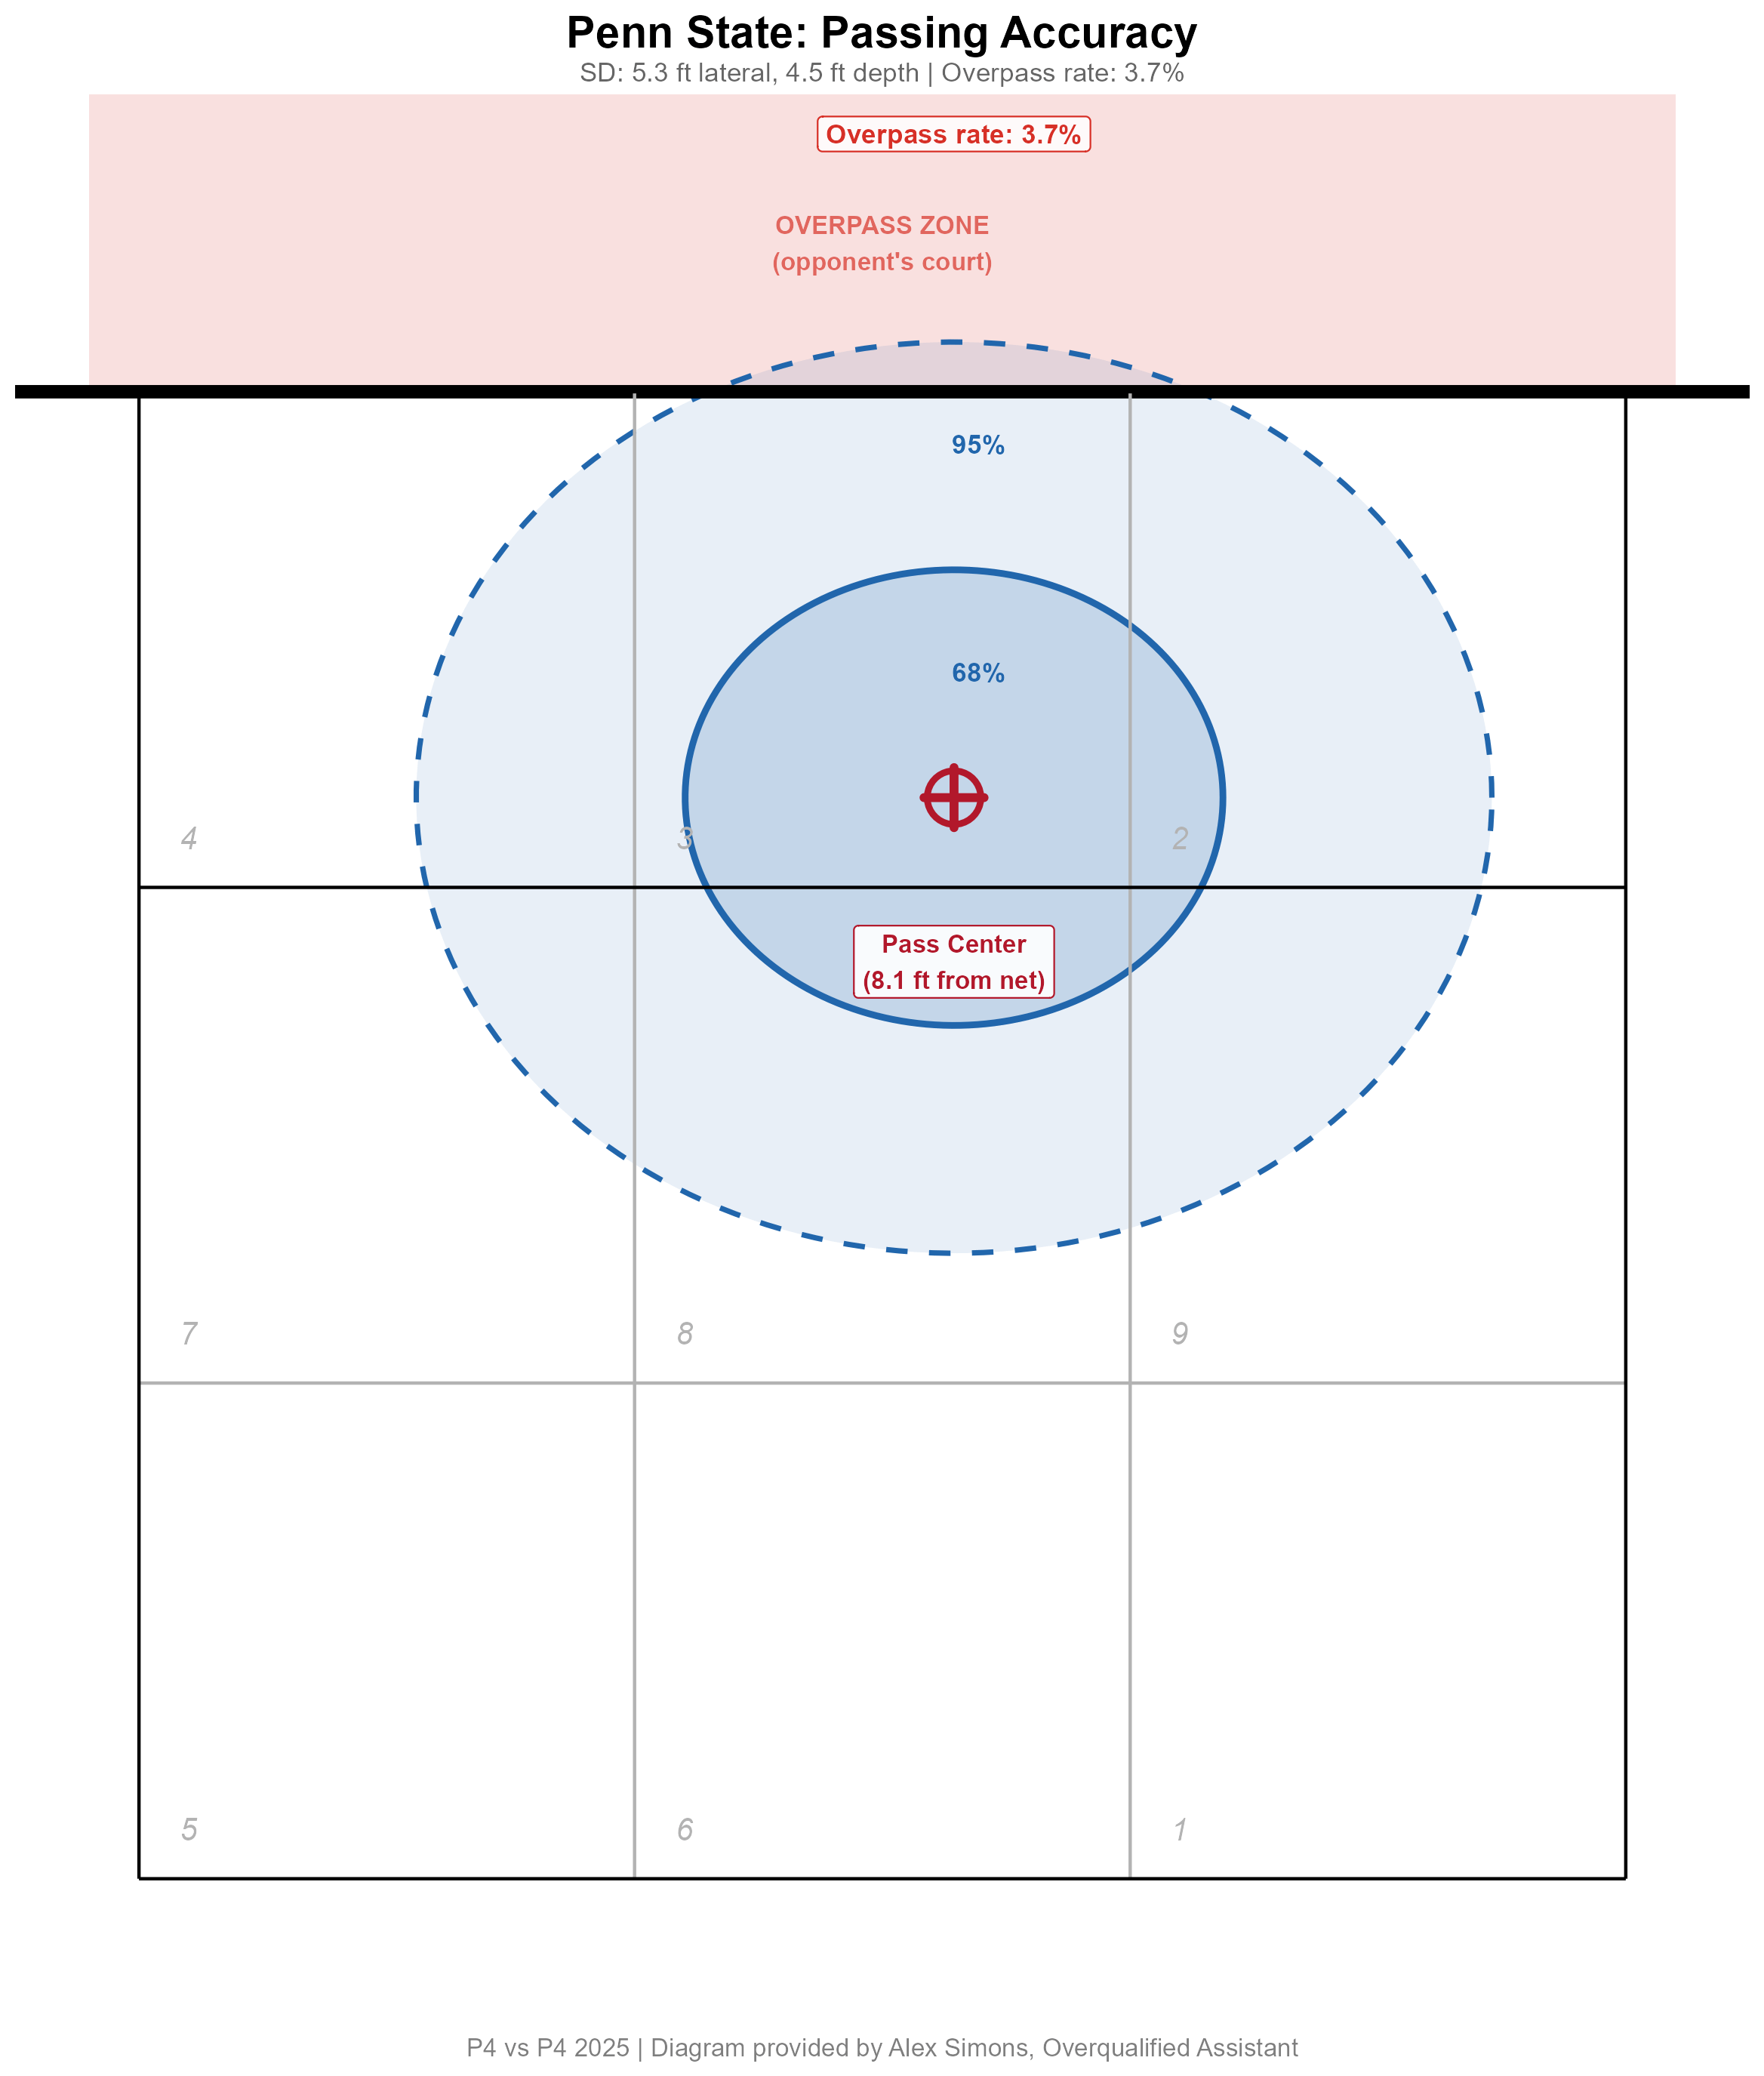
For comparison, here's the same diagram for Penn State. Penn State distribution is notably larger than Nebraska's, particularly in terms of how far off the net their passes landed.
Here's the interesting part: despite the visible difference in spread, both teams have very similar overpass rates (Nebraska 3.9%, Penn State 3.7%).
I don't know if Coach Schumacher-Cawley made a choice to have a passing target 8 feet off the net or if it just happened that way, but Penn State's passing centroid is notably farther off the net than Nebraska's. Whether intentional or not, Penn States deeper passing center point enabled them to keep their overpassing at a manageable level.
To illustrate how important that deeper passing center point is, I created a quick diagram and modeled what would have happened if Penn State had tried to pass as close to the net as Nebraska did:
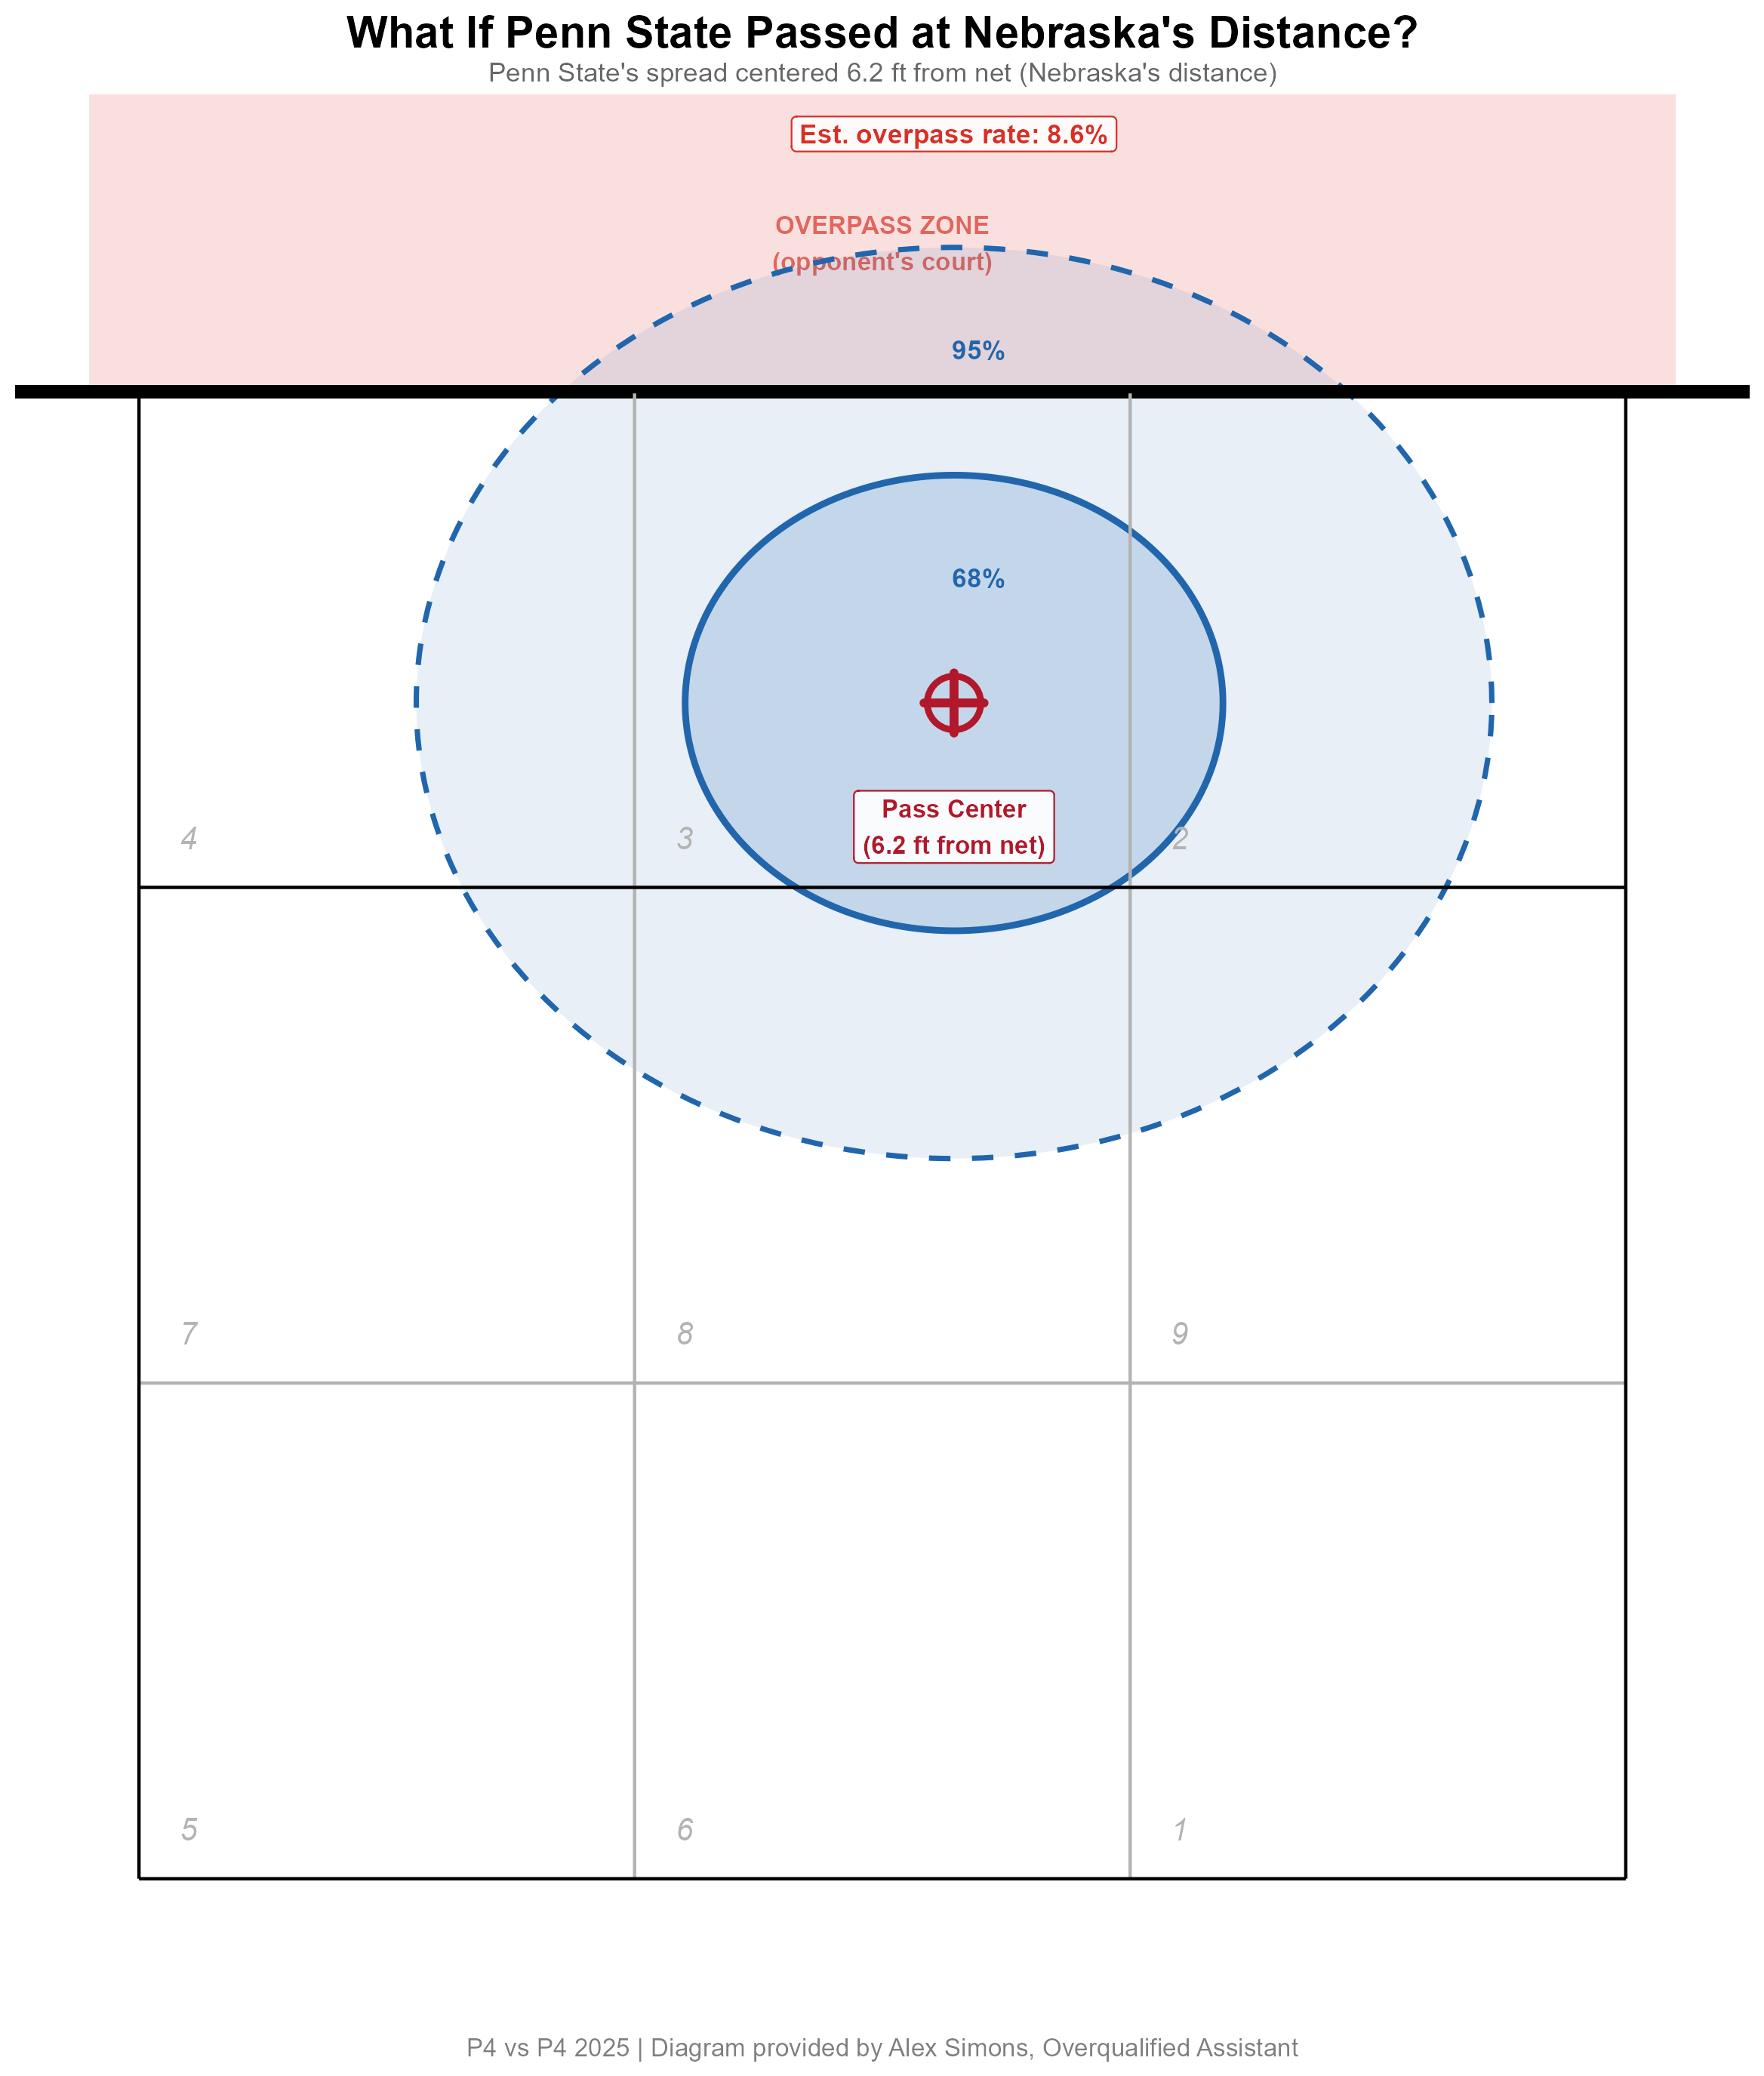
Here you can see that if Penn State had moved their passing target to 6.2 feet from the net (Nebraska's distance), their overpass rate would most likely have jumped from 3.7% to 8.6%! Penn State's wider spread would result in way too many overpasses at that distance. Nebraska can have a passing target that close because their tighter spread keeps the overpasses in check.
This is the key insight: there is no single "right distance" from the net to pass. The right distance depends on your team's passing accuracy.
Coaching takeaway: Two teams can have nearly identical overpass rates while passing to targets at very different distances from the net. A really good passing team (like Nebraska, with a 3.5 foot depth SD) can aim close and benefit from the higher attack efficiencies closer to the net. A less skilled passing team needs to give itself more cushion. Before setting a pass target for your team, consider how much natural scatter your passers have.
Step 4: Finding the Sweet Spot
Now we have reviewed all three of the data sets we need to build the model: the efficiency surface (closer is better), the overpass penalty (-45% in DI), and each team's passing distribution (how much their passes scatter). The model combines them by asking: "For each possible passing target on the court, what's the expected attack efficiency based on their team passing range, including overpasses?"
For every potential passing target, the model considers every location a pass would likely go (weighted by the team's calibrated 2D passing spread), looks up the expected outcome at each landing spot (attack efficiency for on-court passes, negative 45% for overpasses), and sums the weighted results. The location with the highest expected outcome is the team's optimal pass target.
Here are the DI-wide results across 348 teams:
Median optimal depth target: 8.5 feet from the net
Median optimal lateral target: 1.6 feet right of center
Median actual depth: 7.7 feet from the net
Median depth gap: about 0.8 feet
The typical DI team passes about a foot closer to the net than the model says they should. As we saw in the heatmaps, the raw efficiency surface peaks near the net (3 to 5 feet), so why doesn't the model say to aim there? Because the overpass penalty pulls the optimal target back. Even though passes at 3 to 5 feet produce better individual attack efficiency than passes at 8 to 9 feet, the cost of the extra overpasses outweighs the gains.
When we narrow to P4 vs P4 (67 teams), things don't change much:
Median optimal depth target: 8.7 feet from the net
Median optimal lateral target: 1.8 feet right of center
Median actual depth: 7.5 feet from the net
Median depth gap: about 1.2 feet
P4 teams pass a little closer to the net on average than the DI median (7.5 vs 7.7 feet). But their optimal distance is further back (8.7 vs 8.5 feet) because the calibrated passing spread for P4 teams reflects facing tougher servers. The gap between where they pass and where they should aim is about 1.2 feet.
This finding holds true for every one of the P4 teams. They all have an optimal target farther from the net than where they actually passed.
The 3% Rule of Thumb
Here's the part that makes this practical for any coach, without needing to compute your team's passing ranges and standard deviations. The key insight here is that the expected outcome model doesn't try to eliminate all overpasses - it finds the point with the mix of settable passes and overpasses that maximizes the expected outcome. It looks for a balance: close enough to maintain good attacking efficiency, but far enough back that the overpass penalty doesn't drag you under.
When I checked each team's predicted overpass rate if they used their optimal passing target, the numbers cluster super tightly: a median overpass rate of 3.3% for all of DI and 2.7% for P4 teams. That's pretty cool! Across NCAA DI Women's teams, the expected outcome value peaks when the overpass rate is around 3%. We can use that as a good rule of thumb.
Coaching takeaway: You don't need to calculate your team's passing range and standard deviation to use this finding. Just track your overpass rate. If your team overpasses more than 3% of the time, it's very likely (95%+ odds) that you should move your passing target further from the net.
SEC Deep Dive
To make this more concrete (and more fun as well), let's zoom into one conference, the SEC, to see how this applies to what was arguably the top conference in the country last year. Here are all 16 SEC teams from the 2025 P4 vs P4 analysis, sorted by how big the delta between their actual and optimal passing target was in 2025:
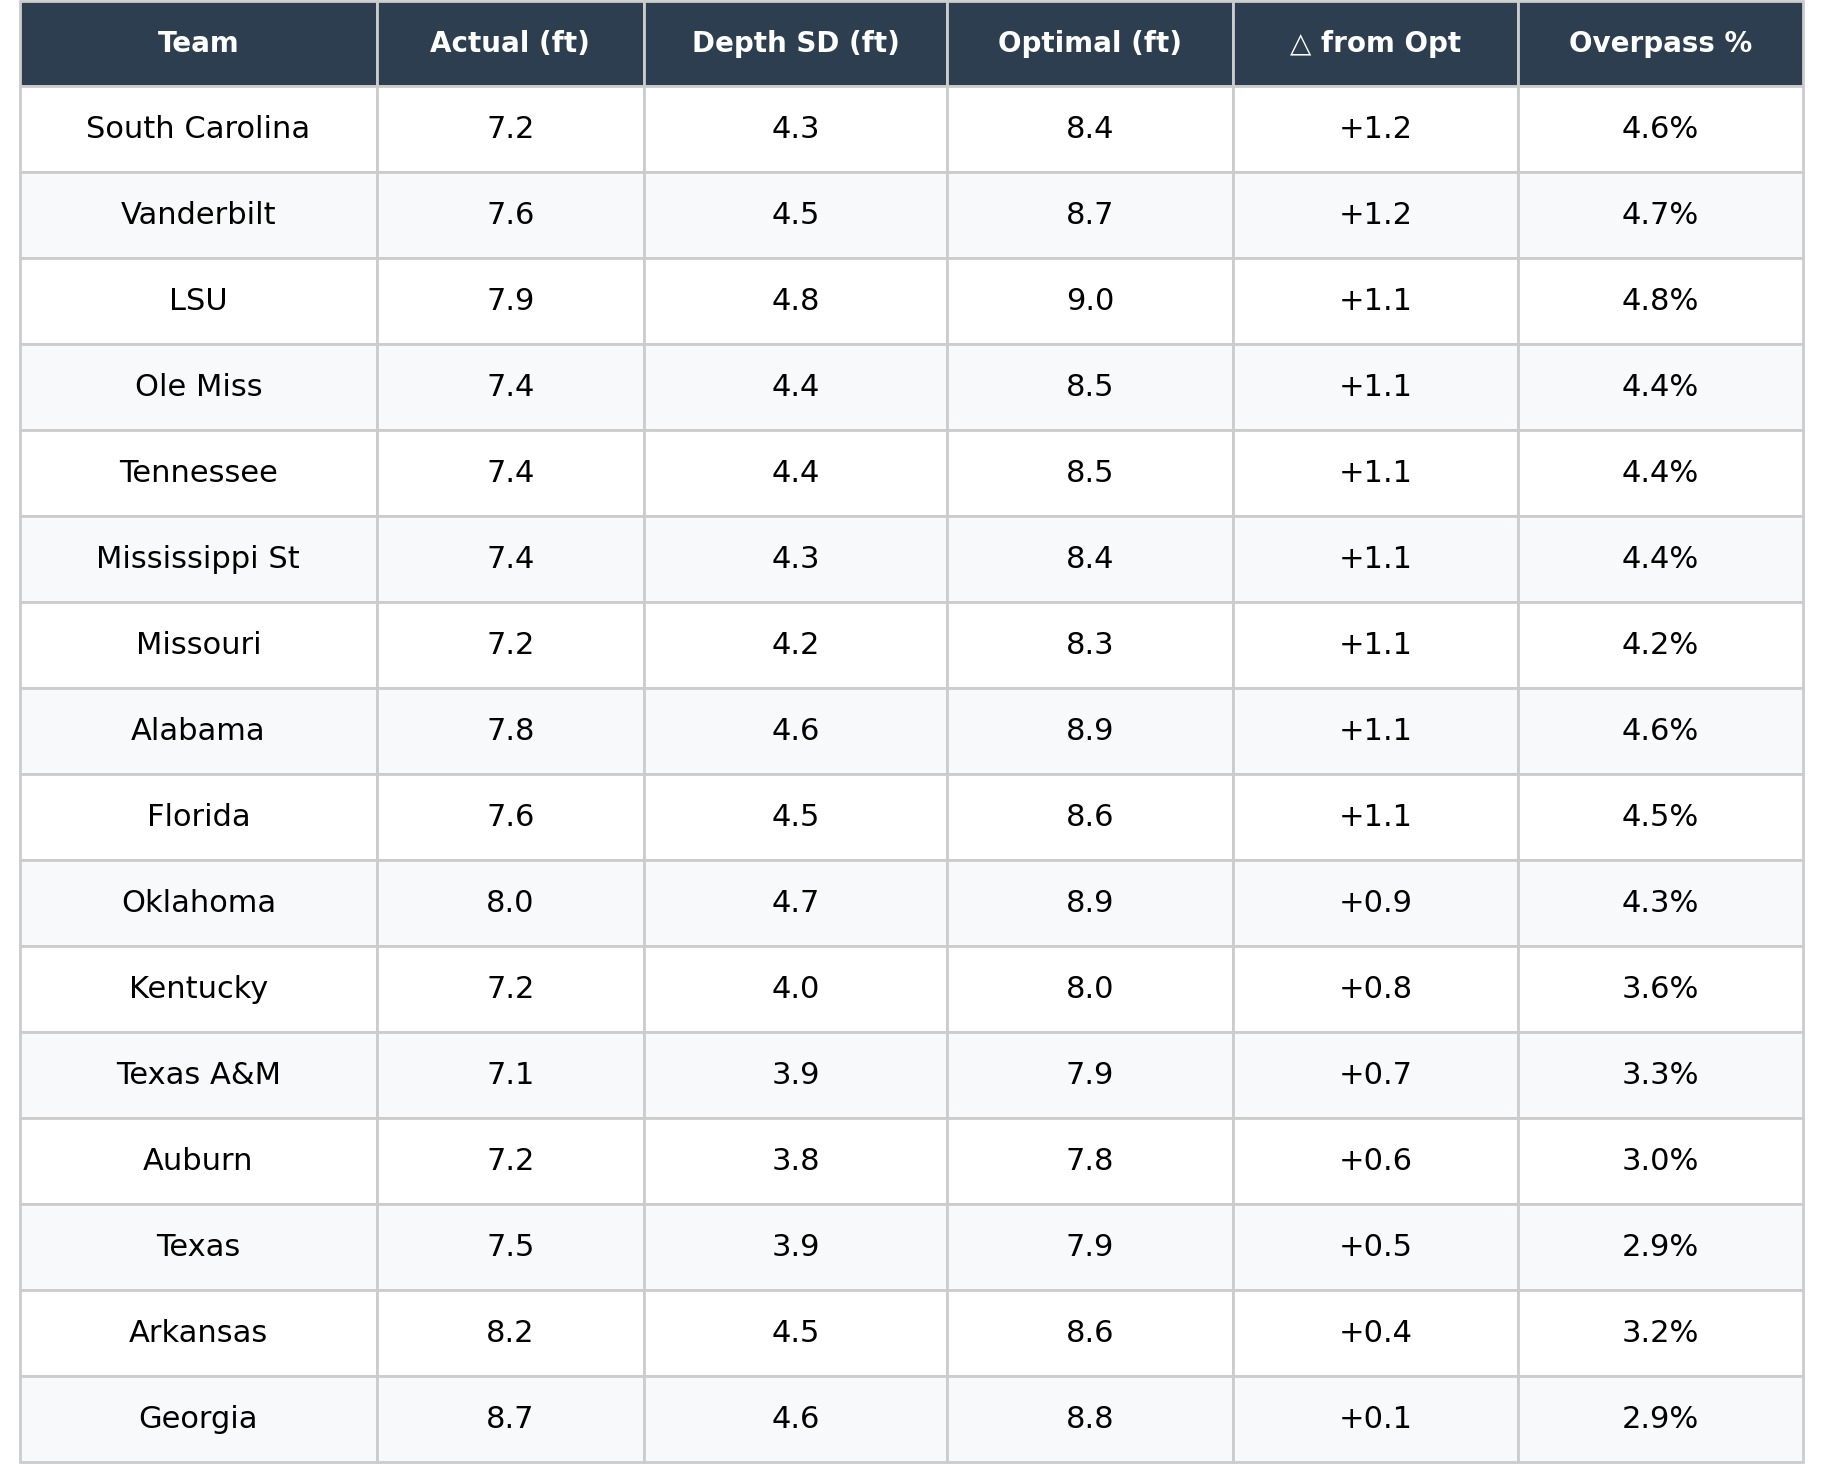
A few things jump out from this table.
First, you'll notice that the teams with the highest overpass %'s in 2025 tend to also have the largest gaps from their optimal passing target. This gives us some confidence that this expected outcome approach is working. South Carolina, Vanderbilt and LSU would all very likely benefit significantly from moving their passing targets deeper into the court.
The bottom of the table also tells a clear story about passing targets.
Teams like Auburn, Texas, Arkansas and Georgia, are doing a pretty good job of using a passing target that is a good fit for their teams and maximizes their expected outcomes. I know Coach Black at Georgia, Coach Crouch at Auburn and Coach Watson at Arkansas and they are all advocates for passing targets that are well off the net. It's nice to see the data reflects and support their philosophies.
That said, for most of these teams, they could move their passing targets a little farther off the net and get better results since the expected value optimizing overpass rate for P4 teams is 2.7%.
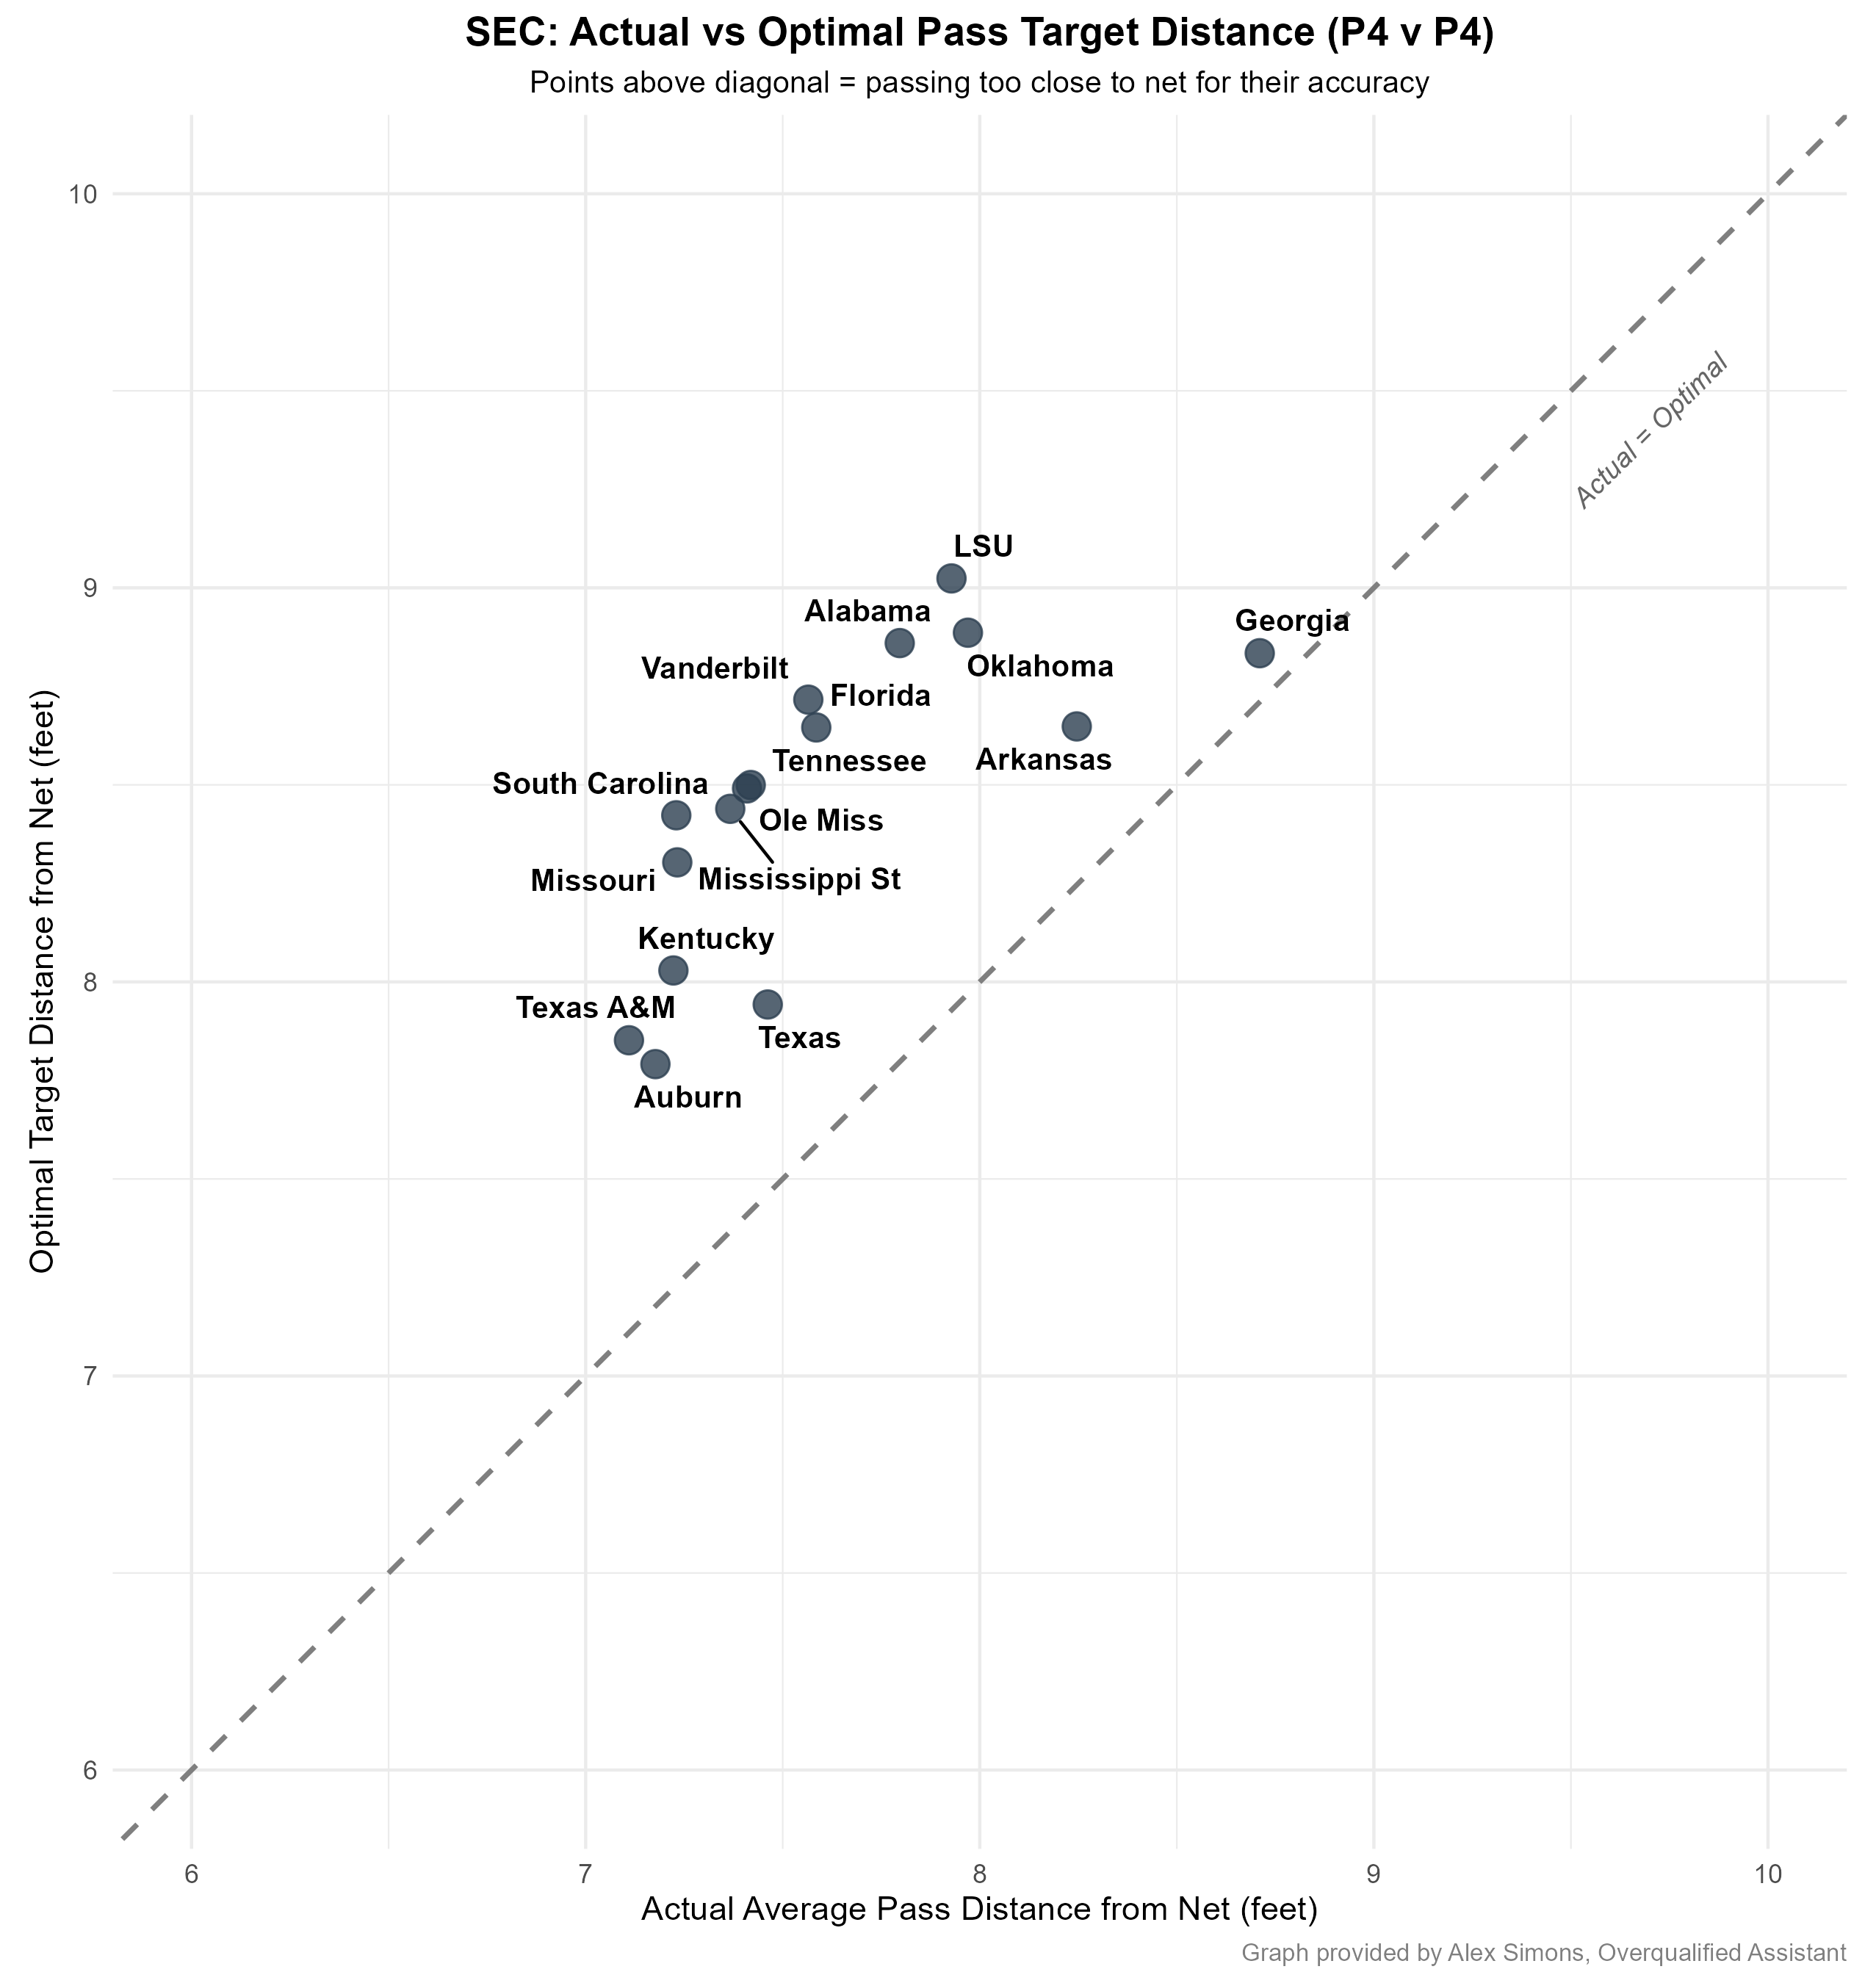
I love this graph as it makes it super easy to quickly see that every single 2025 SEC team's passing center was too close to the net with the exception of Georgia. All but one of them would very likely have better outcomes with a passing target deeper in the court.
Georgia is a fascinating case. They already pass the furthest from the net in the SEC (8.7 feet), and the model says they should be only slightly further back (8.8 feet). Given the quality of this location data, that isn't a meaningful difference. From my perspective, they are the only team I've found in the P4 data passing to their optimal target.
Their depth SD of 4.6 feet is one of the widest in the conference, but because they already pass so deep, Georgia's overpass rate is only 2.9%, one of the lowest in the SEC. They've already compensated for their spread with distance. As I said, I'm sure Coach Black understands their passing reality, and in this case they're basically right at optimal.
Coaching takeaway: If you're an SEC coach (or anyone coaching at the DI level, since these patterns hold across DI), find your team's depth standard deviation and overpass rate. If your depth SD is above 4.0 feet or your overpass rate is above 3% (2.7% in the P4), you'd likely benefit from pulling your passing target off the net more.
Addressing the Pushback
I know for some of you, this finding will be controversial, so let me address a few objections head on.
"You're telling passers to pass worse?"
Not at all. I'm saying that given a team's current accuracy, they may be aiming at the wrong spot. If a team improves their passing precision (reduces their SD), their optimal target moves closer to the net. If your passing improves during the season, definitely move your target closer!
"Overpass rate is only 4.7%, how much can that really matter?"
At negative 45% expected value per overpass, even a small overpass rate creates a large drag on your offense. Reducing your overpass rate from 5% to 3% is equivalent to improving your good pass% by > 6%. That's a huge improvement, one that might take an entire season of practices to realize through another means.
"This ignores what kind of sets the setter can run from different locations."
The efficiency surface captures this implicitly. Passes to zone 3 near the net produce high attack efficiency partly because they enable quicks, slides, and combinations that keep the block from loading up. The model doesn't explicitly model set selection, but the attack outcomes at each location already reflect the full range of sets that teams actually run from that spot. If you could run a full offense from 10 feet off the net, the efficiency surface would show it. It doesn't, and the model accounts for that.
Wrapping Up
This is my first post focusing on the Side Out phase of the game, and I wanted to start by establishing a framework for thinking about passing optimization. The model isn't just an academic exercise. It provides a concrete, team-specific recommendation for where to aim passes, based on three measurable inputs: the efficiency surface, the overpass penalty, and your team's passing accuracy.
The headline finding: the median P4 team passes over a foot closer to the net than the model says they should. That doesn't mean everyone is passing wrong. It means the conventional wisdom of "get it close to the net" is incomplete. It should be "get it close to the net, but not so close that you end up overpassing a lot."
If you have any thoughts or feedback on this post, I’d love to hear about them in the comments, or feel free to email me at alex_simons@hotmail.com
Thanks for reading!
Methodology note: This analysis uses 5,107 match files from the full 2025 NCAA DI season: 682,712 serve receptions and 621,119 pass-to-attack pairs (receptions that led to a set and attack attempt). Pass destination is defined as the setter's ball-contact coordinate (the set's starting location in the match data). Attack efficiency = (kills minus errors) divided by attempts, where errors include both unforced hitting errors and attacks blocked back for a kill, consistent with the standard NCAA definition. The 36-cell heatmap uses the standard scouting zone/subzone grid with a minimum of 100 observations per cell. The 2D efficiency surface uses Gaussian kernel smoothing (bandwidth = 0.20) on a 0.05-unit resolution grid, with the grid extended past the net into an "overpass zone" where every cell is assigned the overpass penalty value rather than a smoothed efficiency. Each team's passing distribution is modeled as a 2D Gaussian with team-level SD_x (lateral) and SD_y (depth). SD_x is computed directly from serve reception coordinates. SD_y is calibrated so that the Gaussian tail past the net matches each team's actual observed overpass rate, correcting for the fact that raw SD computed from kept passes alone underestimates the depth spread. The overpass penalty is the actual opponent attack efficiency on overpass-initiated attacks (45.0% across DI, 44.7% in P4 vs P4), expressed as a negative value from the passing team's perspective. Optimal targets are found by convolving each team's 2D Gaussian kernel with the penalty-augmented efficiency surface across all candidate on-court target locations; the candidate with the highest expected value is the team's optimal target. Because the overpass zone is embedded directly in the efficiency surface, passes that would scatter past the net at a given candidate target automatically incur the overpass penalty in proportion to the team's Gaussian tail beyond the net. P4 vs P4 analysis includes 67 teams and 105,498 receptions, filtered to matches where both teams are from a Power 4 conference. Actual pass center ("actual distance from net") is the mean of all pass landing coordinates for each team. All distances are computed from court coordinates using the standard conversion (1 court unit = 9.84 feet).
Are all overpasses balls passed directly over the net? Or does the category include any pass that doesn't result in a first ball attack?